Phase diagrams
# Author: Óscar Nájera
from __future__ import division, absolute_import, print_function
import os
from math import log, ceil
import numpy as np
import matplotlib.pyplot as plt
import dmft.common as gf
import dmft.dimer as dimer
import dmft.ipt_imag as ipt
def estimate_dos_at_fermi_level_U_vs_tp(tpr, ulist, beta, phase):
dos_fl = []
w_n = gf.matsubara_freq(beta, 3)
save_file = 'dimer_ipt_{}_B{}.npy'.format(phase, beta)
if os.path.exists(save_file):
return -np.load(save_file).T
for tp in tpr:
filestr = 'disk/phase_Dimer_ipt_{}_B{}/tp{:.3}/giw.npy'.format(
phase, beta, tp)
gfs = np.load(filestr)
dos_fl.append(np.array([gf.fit_gf(w_n, gfs[i][0][:3])(0.)
for i in ulist]))
np.save(save_file, dos_fl)
return -np.array(dos_fl).T
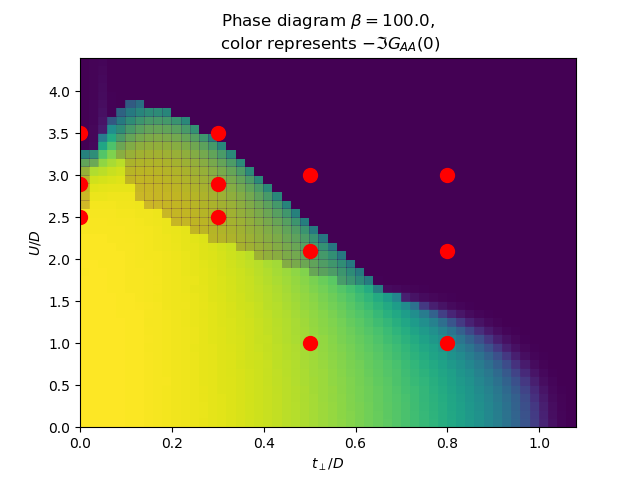
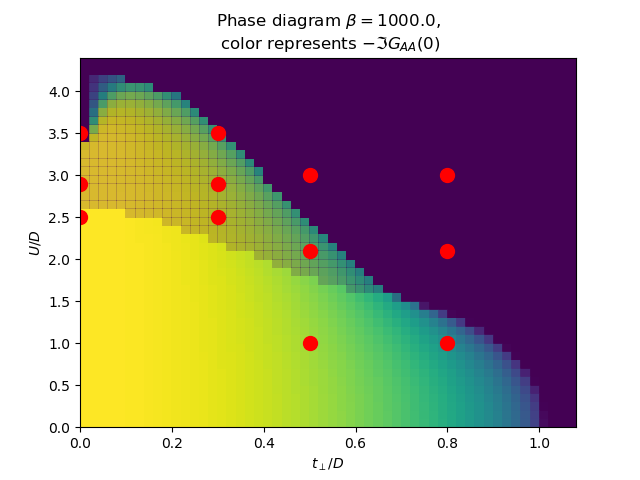
def plot_phase_diagram_U_vs_tp(tpr, ur, beta, ax):
x, y = np.meshgrid(tpr, ur)
ax.pcolormesh(x, y, estimate_dos_at_fermi_level_U_vs_tp(
tpr, range(len(ur)), beta, 'met'), cmap=plt.get_cmap(r'viridis'), vmin=0, vmax=2)
ax.axis([x.min(), x.max(), y.min(), y.max()])
ax.pcolormesh(x, y, estimate_dos_at_fermi_level_U_vs_tp(
tpr, range(len(ur))[::-1], beta, 'ins'), alpha=0.2, cmap=plt.get_cmap(r'viridis'), vmin=0, vmax=2)
TPR = np.arange(0, 1.1, 0.02)
UR = np.arange(0, 4.5, 0.1)
urange = np.linspace(2.4, 3.6, 41)
for beta in [100., 1000.]:
f, ax = plt.subplots()
plot_phase_diagram_U_vs_tp(TPR, UR, beta, ax)
ax.set_xlabel(r'$t_\perp/D$')
ax.set_ylabel(r'$U/D$')
ax.set_title(
'Phase diagram $\\beta={}$,\n color represents $-\\Im G_{{AA}}(0)$'.format(beta))
ax.plot([0, 0, 0, .3, .3, .3, .5, .5, .5, .8, .8, .8],
[2.5, 2.9, 3.5, 2.5, 2.9, 3.5, 1, 2.1, 3, 1, 2.1, 3], 'ro', markersize=10)
def estimate_dos_at_fermi_level_T_vs_U(tp, ulist, temp, phase):
dos_fl = []
save_file = 'dimer_ipt_{}_tp{:.2}.npy'.format(phase, tp)
if os.path.exists(save_file):
return -np.load(save_file)
for T in temp:
w_n = gf.matsubara_freq(1 / T, 3)
filestr = 'disk/phase_Dimer_ipt_{}_tp{}/B{:.5}/giw.npy'.format(
phase, tp, 1 / T)
gfs = np.load(filestr)
dos_fl.append(np.array([gf.fit_gf(w_n, gfs[i][0][:3])(0.)
for i in ulist]))
np.save(save_file, dos_fl)
return -np.array(dos_fl)
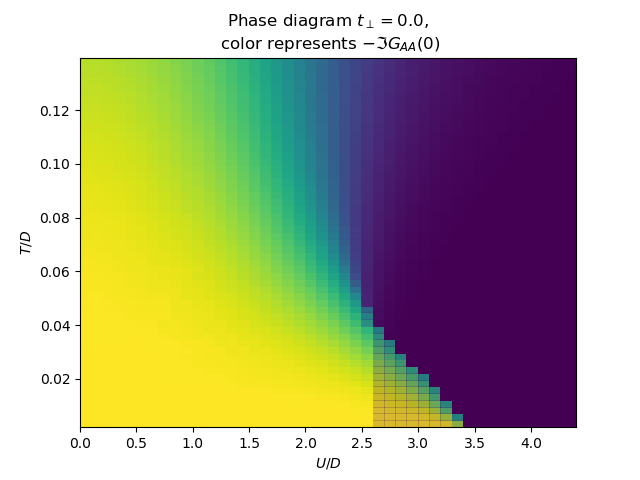
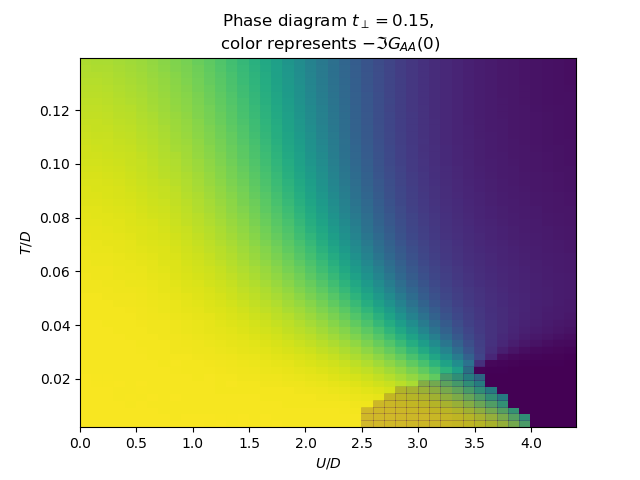
def plot_phase_diagram_T_vs_U(tp, ur, temp, ax):
x, y = np.meshgrid(ur, temp)
ax.pcolormesh(x, y, estimate_dos_at_fermi_level_T_vs_U(
tp, range(len(ur)), temp, 'met'), cmap=plt.get_cmap(r'viridis'), vmin=0, vmax=2)
ax.axis([x.min(), x.max(), y.min(), y.max()])
ax.pcolormesh(x, y, estimate_dos_at_fermi_level_T_vs_U(
tp, range(len(ur))[::-1], temp, 'ins'), alpha=0.2, cmap=plt.get_cmap(r'viridis'), vmin=0, vmax=2)
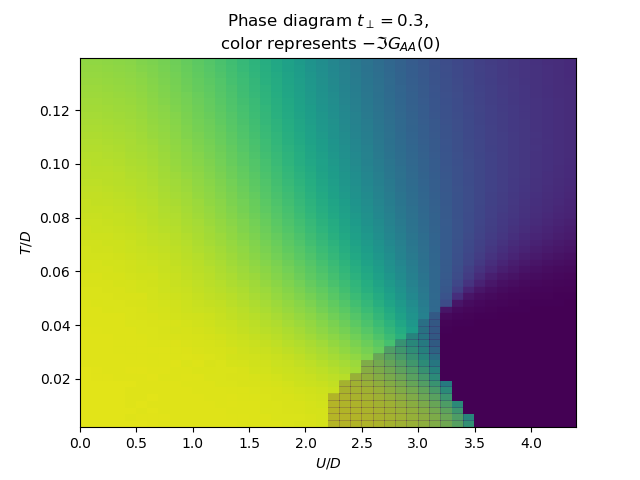
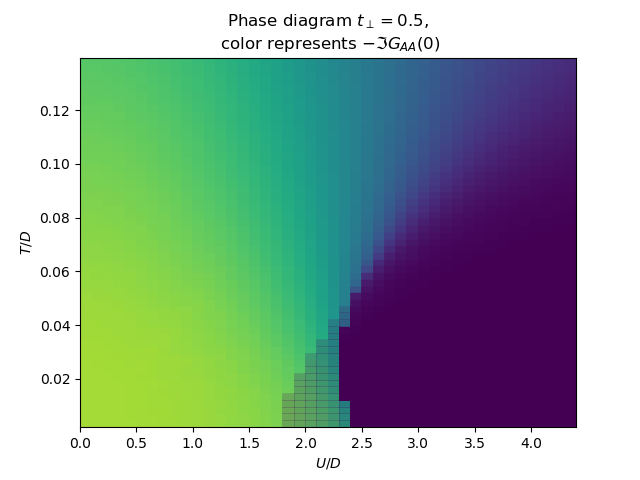
TEMP = np.arange(1 / 500., .14, 1 / 400)
for tp in [0., .15, .3, .5]:
f, ax = plt.subplots()
plot_phase_diagram_T_vs_U(tp, UR, TEMP, ax)
ax.set_ylabel(r'$T/D$')
ax.set_xlabel(r'$U/D$')
ax.set_title(
'Phase diagram $t_\\perp={}$,\n color represents $-\\Im G_{{AA}}(0)$'.format(tp))
plt.show()
ax_Bk = plt.subplot(231)
ax_Bc = plt.subplot(232)
ax_Br = plt.subplot(233)
ax_t0 = plt.subplot(234)
ax_t15 = plt.subplot(235)
ax_t3 = plt.subplot(236)
plot_phase_diagram_U_vs_tp(TPR, UR, 1000., ax_Bk)
ax_Bk.set_ylabel(r'$U/D$')
ax_Bk.set_xlabel(r'$t_\perp/D$')
ax_Bk.plot(0.15 * np.ones_like(UR), UR, 'r-')
ax_Bk.plot(0.3 * np.ones_like(UR), UR, 'r-')
Lowt = plt.subplot(111)
plot_phase_diagram_U_vs_tp(TPR, UR, 30., Lowt)
Lowt.set_ylabel(r'$U/D$')
Lowt.set_xlabel(r'$t_\perp/D$')
plt.show()
plot_phase_diagram_U_vs_tp(TPR, UR, 100., ax_Bc)
ax_Bc.set_xlabel(r'$t_\perp/D$')
ax_Bc.axes.get_yaxis().set_ticklabels([])
plot_phase_diagram_U_vs_tp(TPR, UR, 30., ax_Br)
ax_Br.set_xlabel(r'$t_\perp/D$')
ax_Br.axes.get_yaxis().set_ticklabels([])
plot_phase_diagram_T_vs_U(0.0, UR, TEMP, ax_t0)
ax_t0.set_xlabel(r'$U/D$')
ax_t0.set_ylabel(r'$T/D$')
ax_t0.locator_params(axis='x', tight=True, nbins=6)
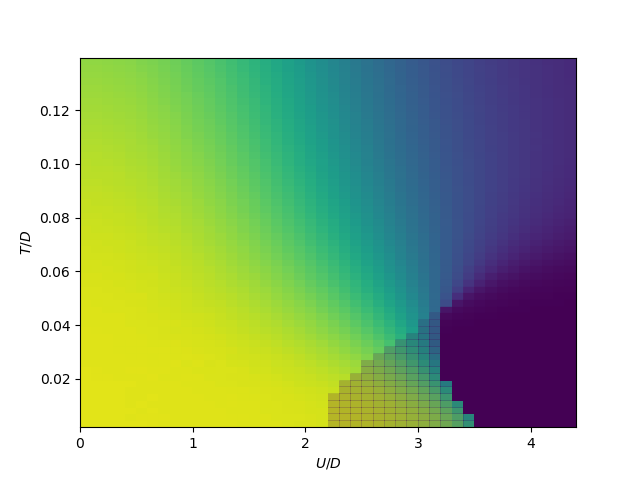
tp0 = plt.subplot(111)
plot_phase_diagram_T_vs_U(0.3, UR, TEMP, tp0)
tp0.set_xlabel(r'$U/D$')
tp0.set_ylabel(r'$T/D$')
tp0.locator_params(axis='x', tight=True, nbins=6)
plt.show()
plot_phase_diagram_T_vs_U(0.15, UR, TEMP, ax_t15)
ax_t15.set_xlabel(r'$U/D$')
ax_t15.locator_params(axis='x', tight=True, nbins=6)
ax_t15.axes.get_yaxis().set_ticklabels([])
plot_phase_diagram_T_vs_U(0.3, UR, TEMP, ax_t3)
ax_t3.set_xlabel(r'$U/D$')
ax_t3.locator_params(axis='x', tight=True, nbins=6)
ax_t3.axes.get_yaxis().set_ticklabels([])
plt.subplots_adjust(wspace=0.05, hspace=0.25)
def estimate_zero_w_sigma_U_vs_tp(tpr, u_range, beta, phase):
sd_zew, so_zew = [], []
tau, w_n = gf.tau_wn_setup(
dict(BETA=beta, N_MATSUBARA=max(2**ceil(log(8 * beta) / log(2)), 256)))
u_range = u_range if phase == 'met' else u_range[::-1]
save_file = 'dimer_ipt_{}_Z_B{}.npy'.format(phase, beta)
if os.path.exists(save_file):
return np.load(save_file)
for tp in tpr:
filestr = 'disk/phase_Dimer_ipt_{}_B{}/tp{:.3}/giw.npy'.format(
phase, beta, tp)
gfs = np.load(filestr)
for i, u_int in enumerate(u_range):
giw_d, giw_o = 1j * gfs[i][0], gfs[i][1]
g0iw_d, g0iw_o = dimer.self_consistency(
1j * w_n, giw_d, giw_o, 0., tp, 0.25)
siw_d, siw_o = ipt.dimer_sigma(u_int, tp, g0iw_d, g0iw_o, tau, w_n)
sd_zew.append(np.polyfit(w_n[:2], siw_d[:2].imag, 1))
so_zew.append(np.polyfit(w_n[:2], siw_o[:2].real, 1))
sd_zew = np.array(sd_zew).reshape(len(tpr), len(u_range), -1)
so_zew = np.array(so_zew).reshape(len(tpr), len(u_range), -1)
np.save(save_file, (sd_zew, so_zew))
return sd_zew, so_zew
def plot_z_diagram_U_vs_tp(tpr, ur, beta, ax):
x, y = np.meshgrid(tpr, ur)
sd_zew, so_zew = estimate_zero_w_sigma_U_vs_tp(tpr, ur, beta, 'met')
z = np.ma.masked_array(sd_zew[:, :, 0], sd_zew[:, :, 1] < -0.1)
ax.pcolormesh(x, y, 1 / (1 - z.T), cmap=plt.get_cmap(r'viridis'))
sd_zew, so_zew = estimate_zero_w_sigma_U_vs_tp(tpr, ur, beta, 'ins')
z = np.ma.masked_array(sd_zew[:, ::-1, 0], sd_zew[:, ::-1, 1] < -0.1)
ax.pcolormesh(x, y, 1 / (1 - z.T),
cmap=plt.get_cmap(r'viridis'), alpha=0.2)
ax.axis([x.min(), x.max(), y.min(), y.max()])
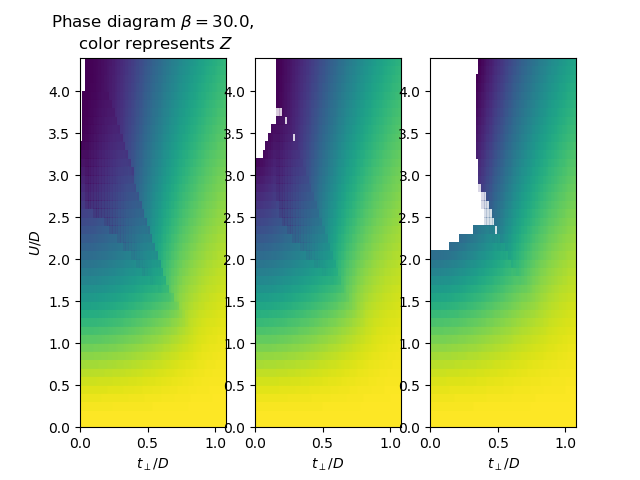
f, ax = plt.subplots(1, 3, sharex=True)
for i, beta in enumerate([1000., 100., 30.]):
plot_z_diagram_U_vs_tp(TPR, UR, beta, ax[i])
ax[i].set_xlabel(r'$t_\perp/D$')
ax[0].set_ylabel(r'$U/D$')
ax[0].set_title(
'Phase diagram $\\beta={}$,\n color represents $Z$'.format(beta))
Total running time of the script: ( 0 minutes 1.369 seconds)