Comparing Spectral functions
# Created Mon Apr 11 14:17:29 2016
# Author: Óscar Nájera

from __future__ import division, absolute_import, print_function

import matplotlib.pyplot as plt
import numpy as np

import dmft.common as gf
import dmft.dimer as dimer
import dmft.ipt_imag as ipt


def ipt_u_tp(u_int, tp, beta, seed='ins'):
    tau, w_n = gf.tau_wn_setup(dict(BETA=beta, N_MATSUBARA=1024))
    giw_d, giw_o = dimer.gf_met(w_n, 0., 0., 0.5, 0.)
    if seed == 'ins':
        giw_d, giw_o = 1 / (1j * w_n + 4j / w_n), np.zeros_like(w_n) + 0j

    giw_d, giw_o, loops = dimer.ipt_dmft_loop(
        beta, u_int, tp, giw_d, giw_o, tau, w_n, 1e-13)
    g0iw_d, g0iw_o = dimer.self_consistency(
        1j * w_n, 1j * giw_d.imag, giw_o.real, 0., tp, 0.25)
    siw_d, siw_o = ipt.dimer_sigma(u_int, tp, g0iw_d, g0iw_o, tau, w_n)

    return siw_d, siw_o, w_n


def plot_pole_eq(w, gf, sig, pole, sty, ax):
    ax.plot(w, -np.abs(sig.imag),
            'r' + sty, label=r'$\Im m \Sigma$')
    ax.plot(w, sig.real,
            'g' + sty, label=r'$\Re e \Sigma$')
    ax.plot(w, -gf.imag / np.pi, 'b' + sty,  label='DOS')
    if pole:
        ax.plot(w, (1 / gf).real, 'c' + sty, label=r'$\Re e G^{-1}$')
    ax.set_ylim([-1, .7])
    ax.axvline(0)
    ax.axhline(0)
    ax.set_xticks(np.arange(-3, 4))
    ax.set_xticklabels(np.arange(-3, 4))
    ax.set_yticklabels([])


def plot_spectral(u_int, tp, BETA, seed, w, w_set, pole, sty, ax):

    siw_d, siw_o, w_n = ipt_u_tp(u_int, tp, BETA, seed)
    ss, _ = dimer.pade_diag(siw_d, siw_o, w_n, w_set, w)
    gst = gf.semi_circle_hiltrans(w - tp - (ss.real - 1j * np.abs(ss.imag)))

    plot_pole_eq(w, gst, ss, pole, sty, ax)
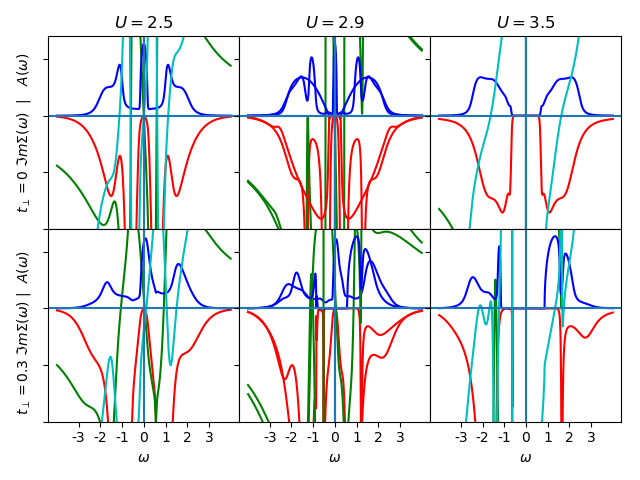
Metals
BETA = 100.
w = np.linspace(-4, 4, 800)
w_set = np.concatenate((np.arange(75), np.arange(75, 150, 20)))
f, ax = plt.subplots(2, 3, sharex=True)
ax[0, 0].set_title(r'$U=2.5$')
ax[0, 0].set_ylabel(r'$t_\perp=0$ $\Im m \Sigma (\omega)$ | $A(\omega)$')
plot_spectral(2.5, 0., BETA, 'met', w, w_set, True, '-', ax[0, 0])
ax[0, 1].set_title(r'$U=2.9$')
plot_spectral(2.9, 0., BETA, 'met', w, w_set, False, '-', ax[0, 1])
plot_spectral(2.9, 0., BETA, 'ins', w, w_set, False, '-', ax[0, 1])
ax[0, 2].set_title(r'$U=3.5$')
plot_spectral(3.5, 0., BETA, 'ins', w, w_set, True, '-', ax[0, 2])
ax[1, 0].set_ylabel(
r'$t_\perp=0.3$ $\Im m \Sigma (\omega)$ | $A(\omega)$ ')
plot_spectral(2.5, 0.3, BETA, 'met', w, w_set, True, '-', ax[1, 0])
plot_spectral(2.9, 0.3, BETA, 'met', w, w_set, False, '-', ax[1, 1])
plot_spectral(2.9, 0.3, BETA, 'ins', w, w_set, False, '-', ax[1, 1])
plot_spectral(3.5, 0.3, BETA, 'ins', w, w_set, True, '-', ax[1, 2])
ax[1, 0].set_xlabel(r'$\omega$')
ax[1, 1].set_xlabel(r'$\omega$')
ax[1, 2].set_xlabel(r'$\omega$')
plt.tight_layout()
plt.subplots_adjust(wspace=0, hspace=0)
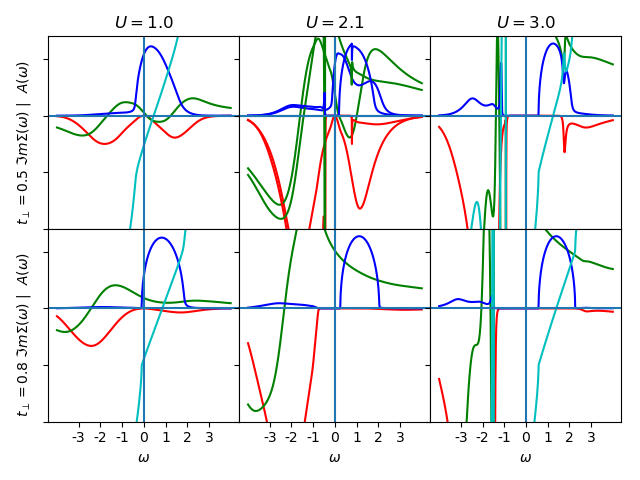
f, ax = plt.subplots(2, 3, sharex=True)
ax[0, 0].set_title(r'$U=1.0$')
ax[0, 0].set_ylabel(
r'$t_\perp=0.5$ $\Im m \Sigma (\omega)$ | $A(\omega)$ ')
plot_spectral(1.0, 0.5, BETA, 'met', w, w_set, True, '-', ax[0, 0])
ax[0, 1].set_title(r'$U=2.1$')
plot_spectral(2.1, 0.5, BETA, 'met', w, w_set, False, '-', ax[0, 1])
plot_spectral(2.1, 0.5, BETA, 'ins', w, w_set, False, '-', ax[0, 1])
ax[0, 2].set_title(r'$U=3.0$')
plot_spectral(3.0, 0.5, BETA, 'ins', w, w_set, True, '-', ax[0, 2])
ax[1, 0].set_ylabel(
r'$t_\perp=0.8$ $\Im m \Sigma (\omega)$ | $A(\omega)$ ')
plot_spectral(1.0, 0.8, BETA, 'met', w, w_set, True, '-', ax[1, 0])
plot_spectral(2.1, 0.8, BETA, 'ins', w, w_set, False, '-', ax[1, 1])
plot_spectral(3.0, 0.8, BETA, 'ins', w, w_set, True, '-', ax[1, 2])
ax[1, 0].set_xlabel(r'$\omega$')
ax[1, 1].set_xlabel(r'$\omega$')
ax[1, 2].set_xlabel(r'$\omega$')
plt.tight_layout()
plt.subplots_adjust(wspace=0, hspace=0)
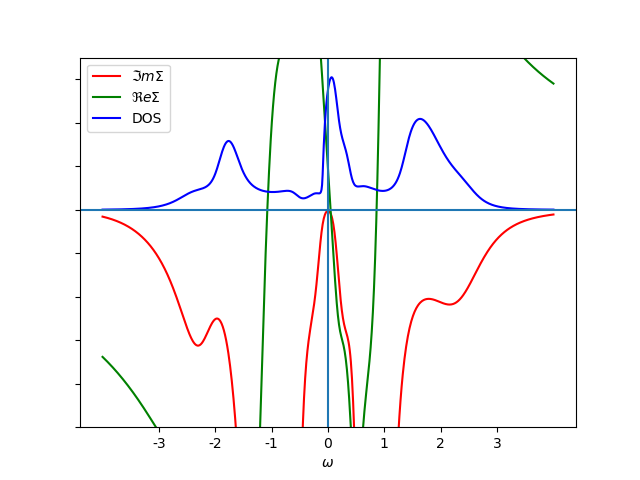
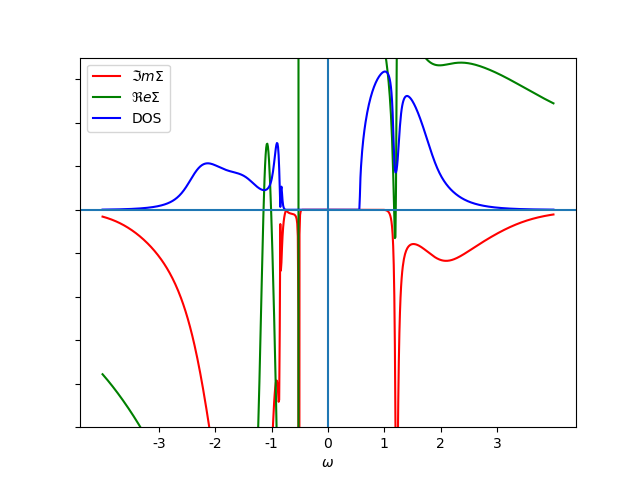
f, a = plt.subplots()
g, b = plt.subplots()
w = np.linspace(-4, 4, 800)
w_set = np.concatenate((np.arange(75), np.arange(75, 150, 20)))
plot_spectral(2.9, 0.3, 100., 'met', w, w_set, False, '-', a)
plot_spectral(2.9, 0.3, 100., 'ins', w, w_set, False, '-', b)
a.set_xlabel(r'$\omega$')
a.legend()
b.set_xlabel(r'$\omega$')
b.legend()
Total running time of the script: ( 0 minutes 4.591 seconds)