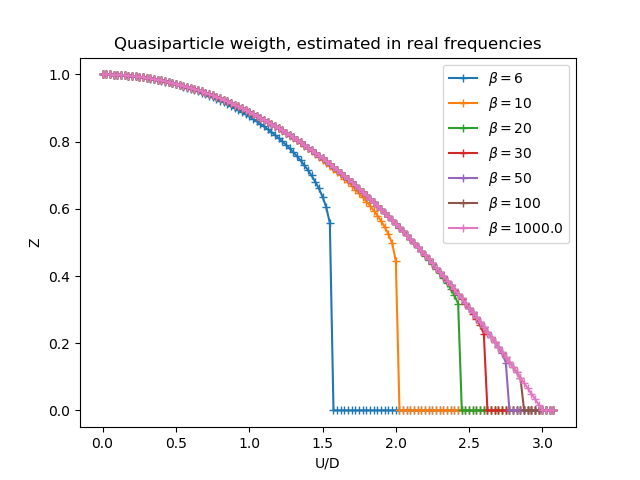
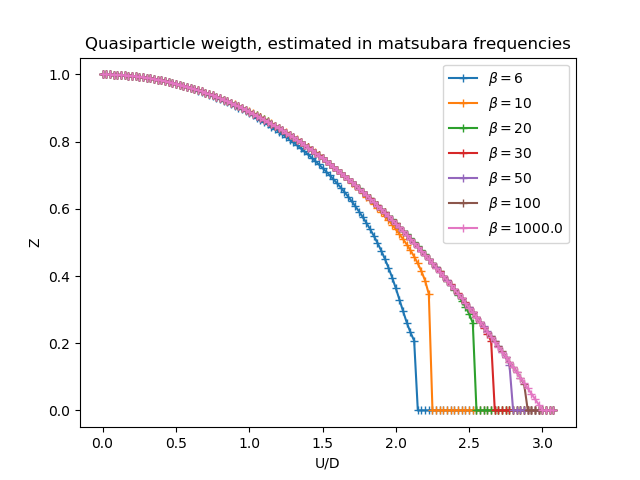
Following the Metal to Mott insulator Transition
Plot of the Quasiparticle weigth decay for the Hubbard Model in the Bethe Lattice as the local interaction is raised.
# Code source: Óscar Nájera
# License: BSD 3 clause

from __future__ import division, absolute_import, print_function
import matplotlib.pyplot as plt
import numpy as np
from dmft.twosite import dmft_loop


def plot_z(axis='matsubara', du=0.05):
    fig = plt.figure()
    u_int = np.arange(0, 6.2, du)
    for beta in [6, 10, 20, 30, 50, 100, 1e3]:
        out_file = axis + '_halffill_b{}_dU{}'.format(beta, du)
        try:
            res = np.load(out_file + '.npy')
        except IOError:
            res = dmft_loop(u_int, axis, beta=beta, hop=1)
            np.save(out_file, res)

        plt.plot(res[:, 0] / 2, res[:, 1], '+-',
                 label='$\\beta = {}$'.format(beta))

    plt.legend(loc=0)
    plt.title('Quasiparticle weigth, estimated in {} frequencies'.format(axis))
    plt.ylabel('Z')
    plt.xlabel('U/D')
    fig.savefig(out_file + '_Z.png', format='png',
                transparent=False, bbox_inches='tight', pad_inches=0.05)


plot_z('real')
plot_z('matsubara')
Total running time of the script: ( 0 minutes 2.047 seconds)