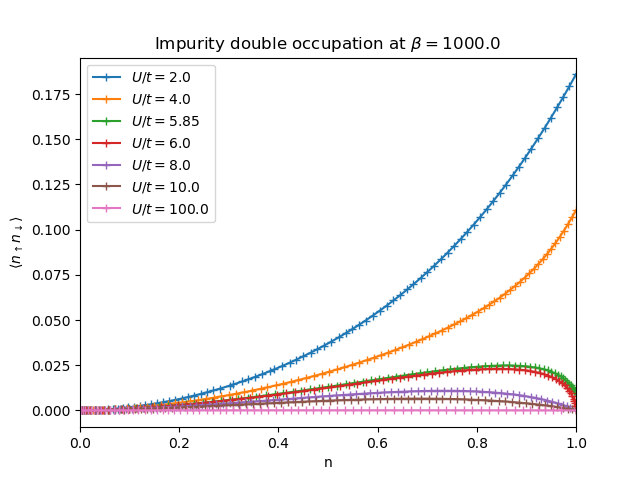
Double occupation of the Impurity
Plot of the double occupation average on the Impurity site as a function of the lattice doping and at diffent local interaction strenghs
# Code source: Óscar Nájera
# License: BSD 3 clause

from __future__ import division, absolute_import, print_function
import matplotlib.pyplot as plt
import numpy as np
from dmft.twosite_dop import dmft_loop_dop


def plot_d(axis='real', beta=1e3, u_int=np.array([2., 4., 5.85, 6., 8., 10., 100.])):
    fig = plt.figure()
    for u in u_int:
        out_file = axis + '_dop_b{}_U{}'.format(beta, u)
        try:
            res = np.load(out_file + '.npy')
        except IOError:
            res = dmft_loop_dop(u)
            np.save(out_file, res)

        d = [sim.double_ocupation() for sim in res[:, 1]]
        plt.plot(res[:, 0], d, '+-', label='$U/t= {}$'.format(u))

    plt.legend(loc=0)
    plt.title('Impurity double occupation at $\\beta={}$'.format(beta))
    plt.ylabel('$\\langle n_\\uparrow n_\\downarrow \\rangle$')
    plt.xlabel('n')
    plt.xlim([0, 1])
    fig.savefig(out_file + '_b.png', format='png',
                transparent=False, bbox_inches='tight', pad_inches=0.05)

plot_d()
Total running time of the script: ( 0 minutes 1.812 seconds)