Zero frequency behavior of Sigma
# Created Mon Mar 7 19:19:04 2016
# Author: Óscar Nájera
from __future__ import division, absolute_import, print_function
import os
from math import log, ceil
import numpy as np
import matplotlib.pyplot as plt
import dmft.common as gf
import dmft.dimer as dimer
import dmft.ipt_imag as ipt
def estimate_zero_w_sigma_U_vs_tp(tpr, u_range, beta, phase):
sd_zew, so_zew = [], []
tau, w_n = gf.tau_wn_setup(
dict(BETA=beta, N_MATSUBARA=max(2**ceil(log(8 * beta) / log(2)), 256)))
u_range = u_range if phase == 'met' else u_range[::-1]
save_file = 'dimer_ipt_{}_Z_B{}.npy'.format(phase, beta)
if os.path.exists(save_file):
return np.load(save_file)
for tp in tpr:
filestr = 'disk/phase_Dimer_ipt_{}_B{}/tp{:.3}/giw.npy'.format(
phase, beta, tp)
gfs = np.load(filestr)
for i, u_int in enumerate(u_range):
giw_d, giw_o = 1j * gfs[i][0], gfs[i][1]
g0iw_d, g0iw_o = dimer.self_consistency(
1j * w_n, giw_d, giw_o, 0., tp, 0.25)
siw_d, siw_o = ipt.dimer_sigma(u_int, tp, g0iw_d, g0iw_o, tau, w_n)
sd_zew.append(np.polyfit(w_n[:2], siw_d[:2].imag, 1))
so_zew.append(np.polyfit(w_n[:2], siw_o[:2].real, 1))
sd_zew = np.array(sd_zew).reshape(len(tpr), len(u_range), -1)
so_zew = np.array(so_zew).reshape(len(tpr), len(u_range), -1)
np.save(save_file, (sd_zew, so_zew))
return sd_zew, so_zew
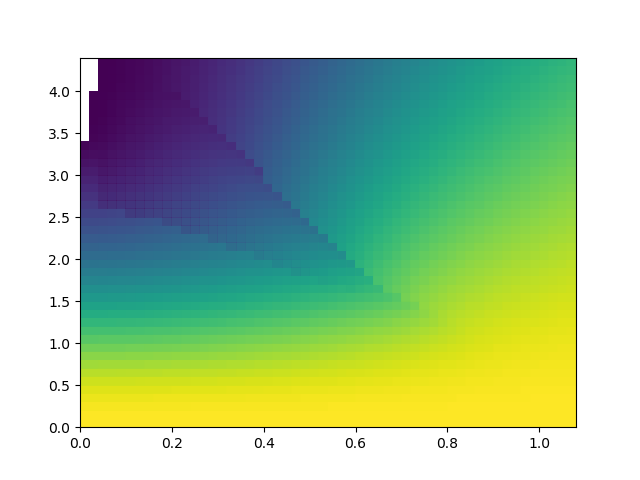
def plot_z_diagram_U_vs_tp(tpr, ur, beta, ax):
x, y = np.meshgrid(tpr, ur)
sd_zew, so_zew = estimate_zero_w_sigma_U_vs_tp(tpr, ur, beta, 'met')
z = np.ma.masked_array(sd_zew[:, :, 0], sd_zew[:, :, 1] < -0.1)
ax.pcolormesh(x, y, 1 / (1 - z.T), cmap=plt.get_cmap(r'viridis'))
sd_zew, so_zew = estimate_zero_w_sigma_U_vs_tp(tpr, ur, beta, 'ins')
z = np.ma.masked_array(sd_zew[:, ::-1, 0], sd_zew[:, ::-1, 1] < -0.1)
ax.pcolormesh(x, y, 1 / (1 - z.T),
cmap=plt.get_cmap(r'viridis'), alpha=0.2)
ax.axis([x.min(), x.max(), y.min(), y.max()])
TPR = np.arange(0, 1.1, 0.02)
UR = np.arange(0, 4.5, 0.1)
f, ax = plt.subplots()
plot_z_diagram_U_vs_tp(TPR, UR, 1000., ax)
def estimate_zero_w_sigma_T_vs_U(tp, u_range, temp, phase):
sd_zew, so_zew = [], []
u_range = u_range if phase == 'met' else u_range[::-1]
save_file = 'dimer_ipt_{}_Z_tp{:.2}.npy'.format(phase, tp)
if os.path.exists(save_file):
return np.load(save_file)
for T in temp:
beta = 1 / T
tau, w_n = gf.tau_wn_setup(
dict(BETA=beta, N_MATSUBARA=max(2**ceil(log(6 * beta) / log(2)), 256)))
filestr = 'disk/phase_Dimer_ipt_{}_tp{:.2}/B{:.5}/giw.npy'.format(
phase, tp, beta)
gfs = np.load(filestr)
for i, u_int in enumerate(u_range):
giw_d, giw_o = 1j * gfs[i][0], gfs[i][1]
g0iw_d, g0iw_o = dimer.self_consistency(
1j * w_n, giw_d, giw_o, 0., tp, 0.25)
siw_d, siw_o = ipt.dimer_sigma(u_int, tp, g0iw_d, g0iw_o, tau, w_n)
sd_zew.append(np.polyfit(w_n[:2], siw_d[:2].imag, 1))
so_zew.append(np.polyfit(w_n[:2], siw_o[:2].real, 1))
sd_zew = np.array(sd_zew).reshape(len(temp), len(u_range), -1)
so_zew = np.array(so_zew).reshape(len(temp), len(u_range), -1)
np.save(save_file, (sd_zew, so_zew))
return sd_zew, so_zew
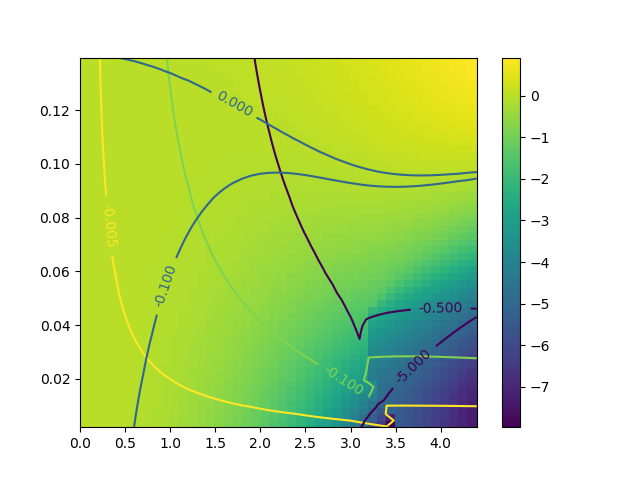
def plot_z_diagram_T_vs_U(tp, ur, temp, ax):
x, y = np.meshgrid(ur, temp)
sd_zew, so_zew = estimate_zero_w_sigma_T_vs_U(tp, ur, temp, 'met')
z = np.ma.masked_array(sd_zew[:, :, 0], sd_zew[:, :, 0] > 70)
#z = sd_zew[:, :, 0]
c = ax.pcolormesh(x, y, z, cmap=plt.get_cmap(r'viridis'))
plt.colorbar(c)
CS = ax.contour(x, y, sd_zew[:, :, 1],
levels=[-.5, -.1, -.005])
ax.clabel(CS, inline=1, fontsize=10)
CS = ax.contour(x, y, sd_zew[:, :, 0],
levels=[-5, -.1, 0, 10])
ax.clabel(CS, inline=1, fontsize=10)
# sd_zew, so_zew = estimate_zero_w_sigma_T_vs_U(tp, ur, temp, 'ins')
# z = np.ma.masked_array(sd_zew[:, ::-1, 0], sd_zew[:, ::-1, 0] > 2)
# #z = sd_zew[:, ::-1, 0]
# ax.pcolormesh(x, y, - z, cmap=plt.get_cmap(r'viridis'), alpha=0.5)
# CS = ax.contour(x, y, sd_zew[:, ::-1, 1],
# levels=-np.arange(.1, 5, .5)[::-1])
# ax.clabel(CS, inline=1, fontsize=10)
# CS = ax.contour(x, y, sd_zew[:, ::-1, 0],
# levels=np.arange(-.1, 10, .5))
# ax.clabel(CS, inline=1, fontsize=10)
ax.axis([x.min(), x.max(), y.min(), y.max()])
f, ax = plt.subplots()
TEMP = np.arange(1 / 500., .14, 1 / 400.)
plot_z_diagram_T_vs_U(0.3, UR, TEMP, ax)
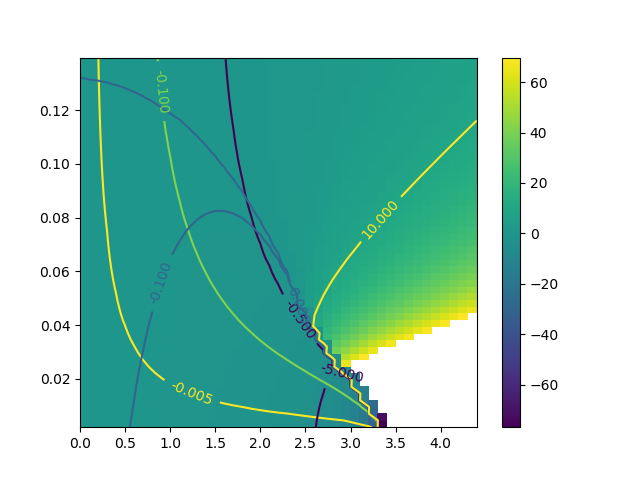
f, ax = plt.subplots()
plot_z_diagram_T_vs_U(0., UR, TEMP, ax)
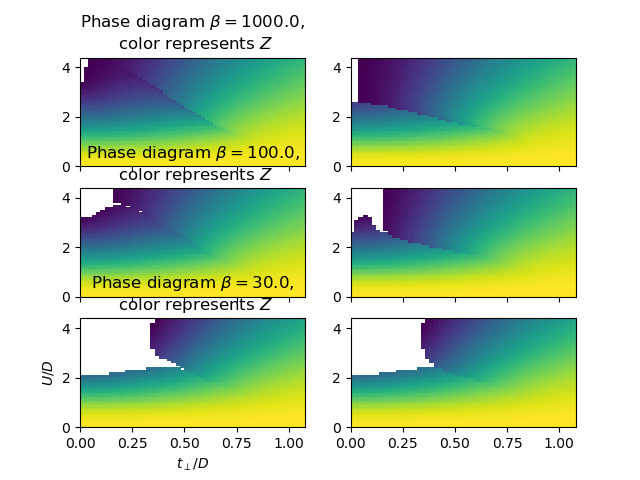
def plot_z_diagram_U_vs_tp(tpr, ur, beta, ax):

    x, y = np.meshgrid(tpr, ur)

    sd_zew, so_zew = estimate_zero_w_sigma_U_vs_tp(tpr, ur, beta, 'met')
    z = np.ma.masked_array(sd_zew[:, :, 0], sd_zew[:, :, 1] < -0.1)
    ax[0].pcolormesh(x, y, 1 / (1 - z.T), cmap=plt.get_cmap(r'viridis'))
    ax[0].axis([x.min(), x.max(), y.min(), y.max()])

    sd_zew, so_zew = estimate_zero_w_sigma_U_vs_tp(tpr, ur, beta, 'ins')
    z = np.ma.masked_array(sd_zew[:, ::-1, 0], sd_zew[:, ::-1, 1] < -0.1)
    ax[1].pcolormesh(x, y, 1 / (1 - z.T),
                     cmap=plt.get_cmap(r'viridis'))
    ax[1].axis([x.min(), x.max(), y.min(), y.max()])

f, ax = plt.subplots(3, 2, sharex=True)

for i, beta in enumerate([1000., 100., 30.]):
    plot_z_diagram_U_vs_tp(TPR, UR, beta, ax[i])
    ax[i][0].set_title(
        'Phase diagram $\\beta={}$,\n color represents $Z$'.format(beta))
ax[2][0].set_xlabel(r'$t_\perp/D$')
ax[2][0].set_ylabel(r'$U/D$')
Plots over the shapes of Sigma at zero frequency
sdm_zew, som_zew = estimate_zero_w_sigma_U_vs_tp(TPR, UR, 100., 'met')
sdi_zew, soi_zew = estimate_zero_w_sigma_U_vs_tp(TPR, UR, 100., 'ins')
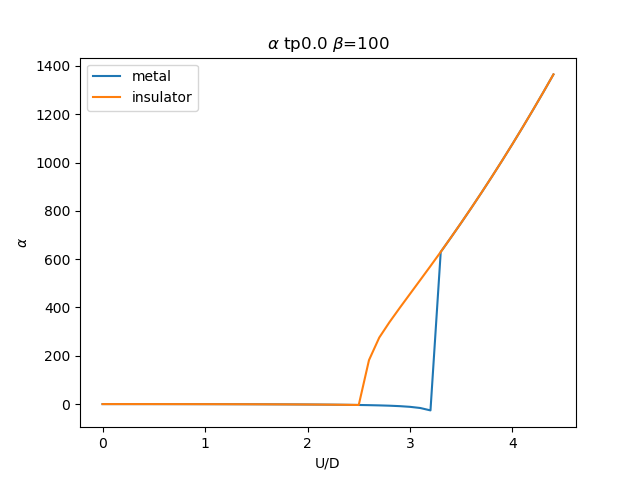
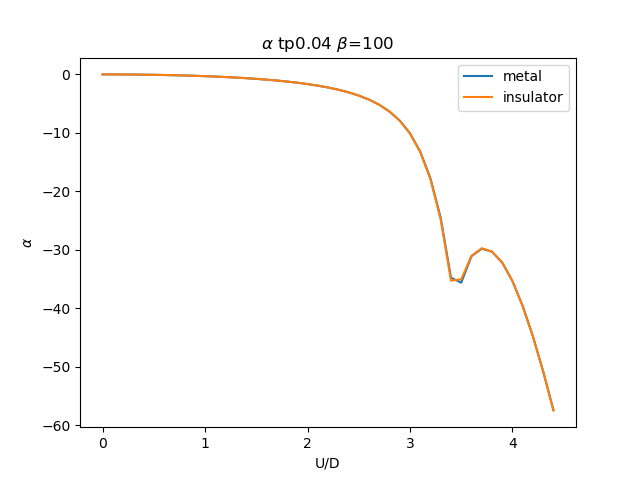
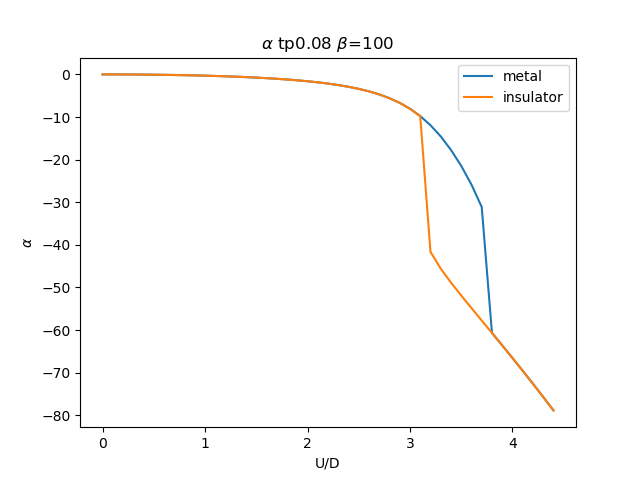
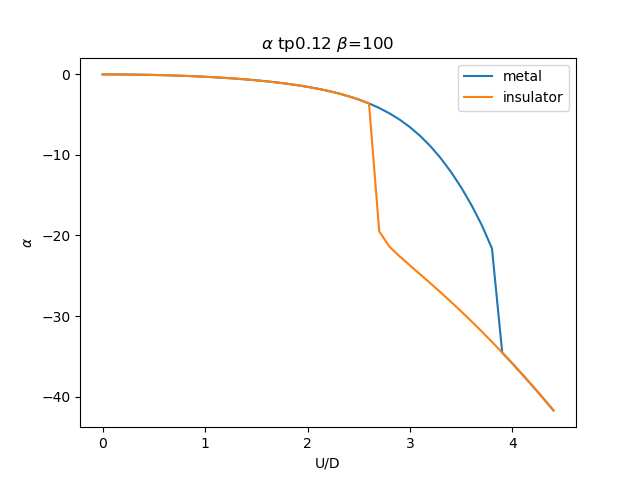
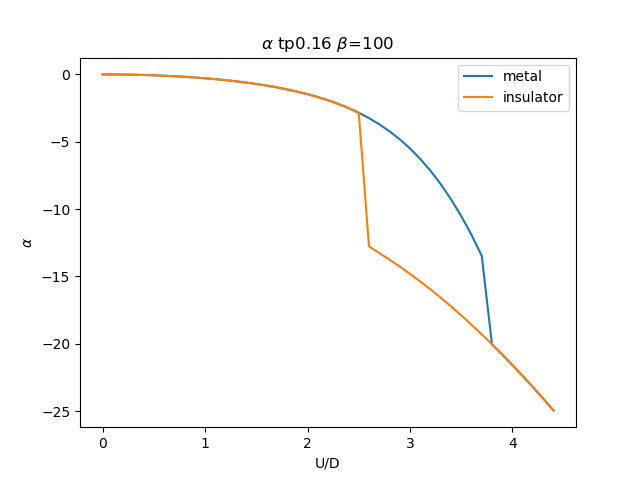
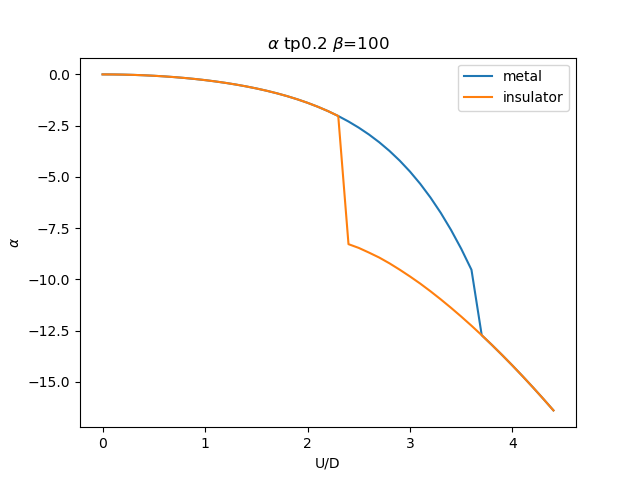
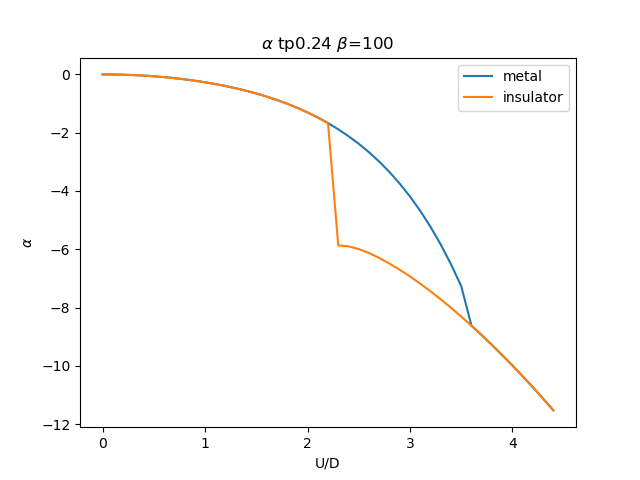
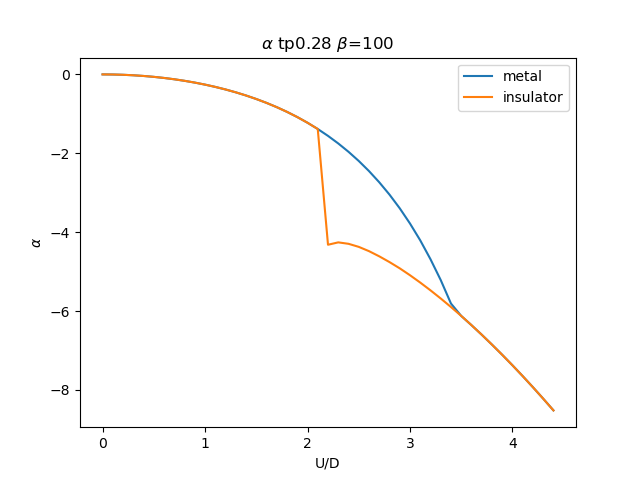
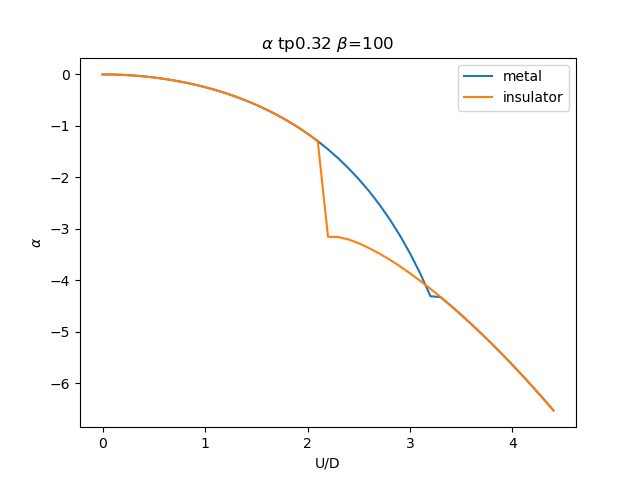
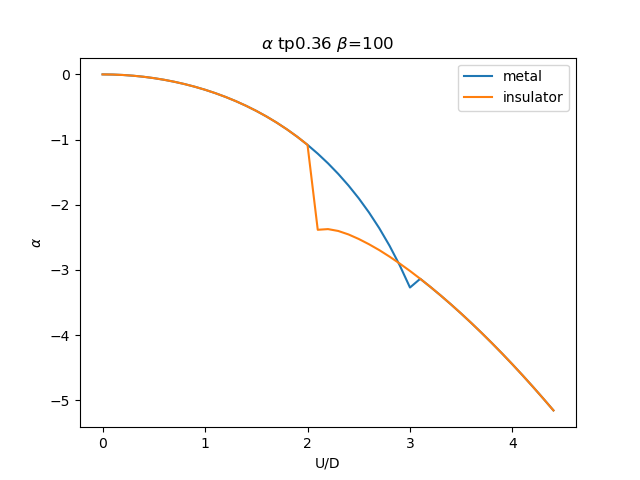
for i, tp in list(enumerate(TPR))[:20:2]:
# \Alpha
plt.figure()
plt.plot(UR, sdm_zew[i, :, 0], label='metal')
plt.plot(UR, sdi_zew[i, ::-1, 0], label='insulator')
min_y = np.min(np.concatenate((sdm_zew[i, :, 0], sdi_zew[i, ::-1, 0])))
#plt.ylim([min_y, 0])
plt.legend()
plt.ylabel(r'$\alpha$')
plt.xlabel(r'U/D')
plt.title(r'$\alpha$ tp{} $\beta$=100'.format(tp))
plt.savefig('SIGMA_AA_alpha_tp{}_B100.png'.format(tp))
# plt.close()
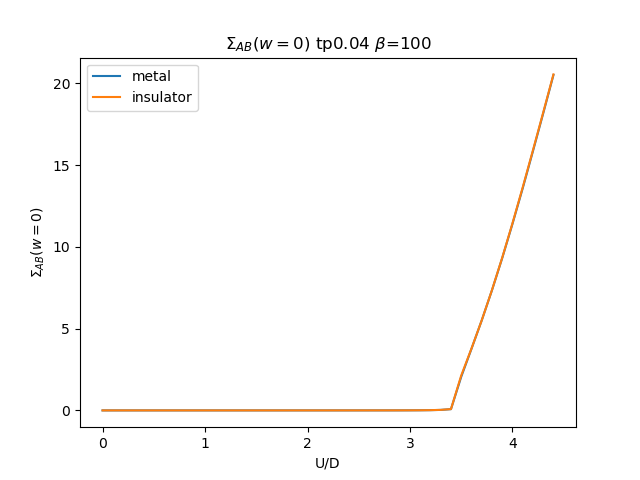
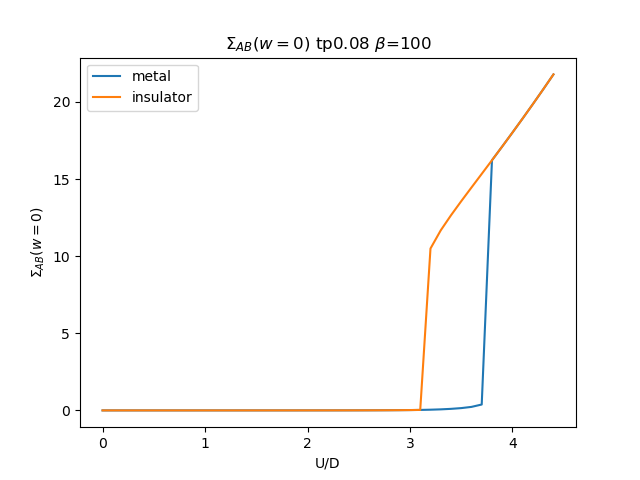
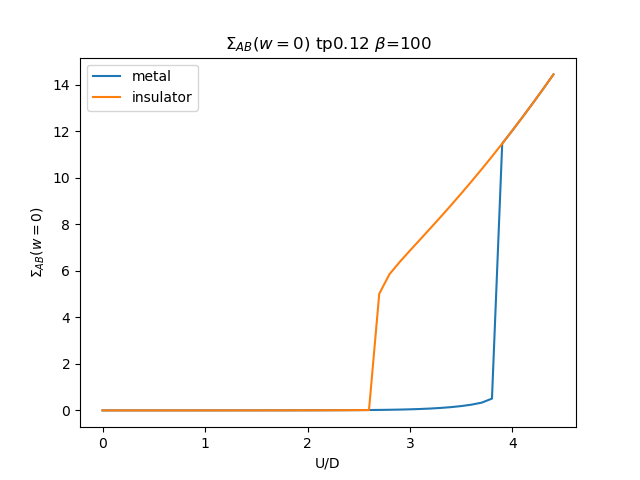
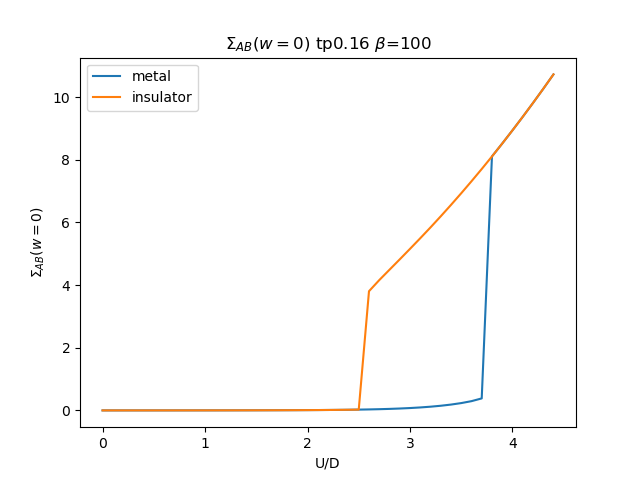
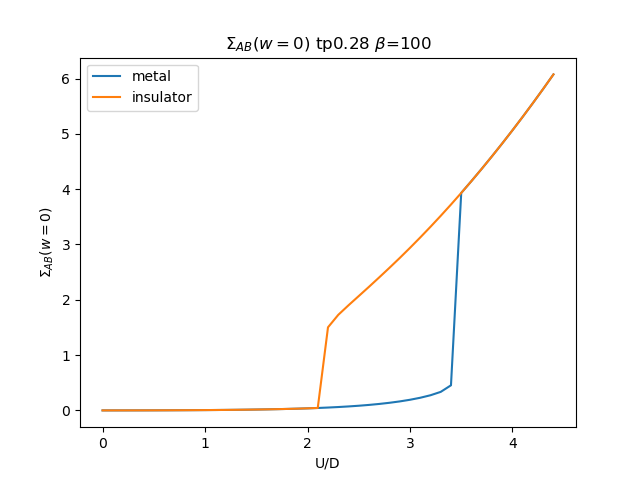
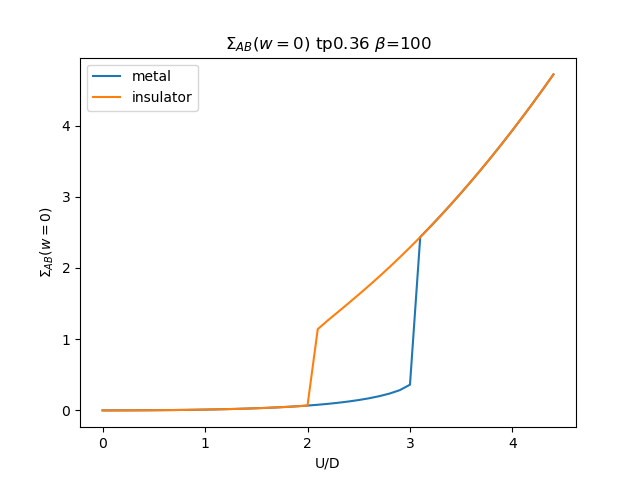
# \Sigma AB
plt.figure()
plt.plot(UR, som_zew[i, :, 1], label='metal')
plt.plot(UR, soi_zew[i, ::-1, 1], label='insulator')
plt.legend()
plt.ylabel(r'$\Sigma_{{AB}}(w=0)$')
plt.xlabel(r'U/D')
plt.title(r'$\Sigma_{{AB}}(w=0)$ tp{} $\beta$=100'.format(tp))
plt.savefig('SIGMA_AB_cut_tp{}_B100.png'.format(tp))
# plt.close()
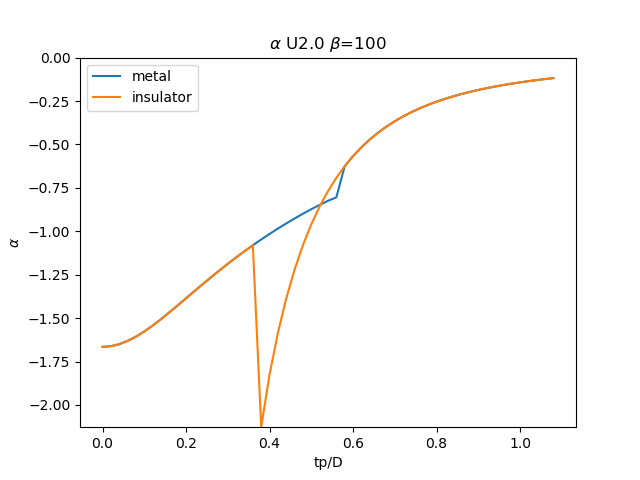
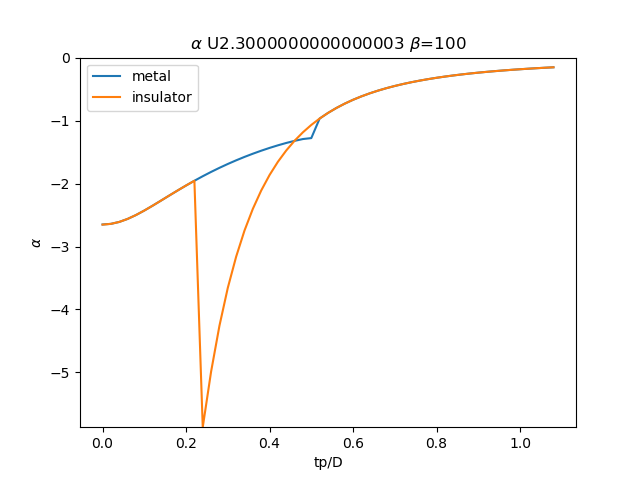
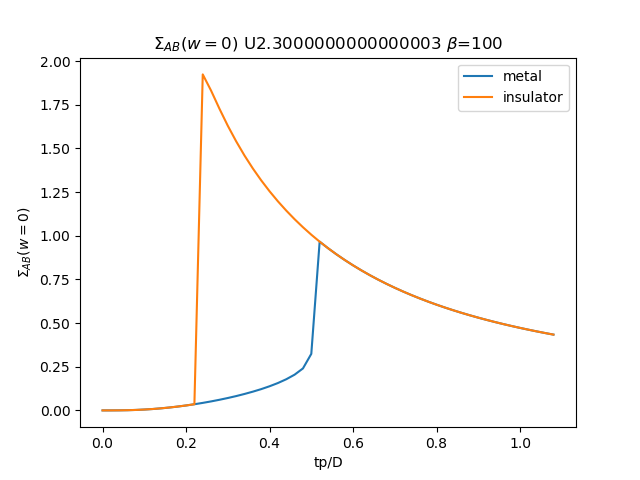
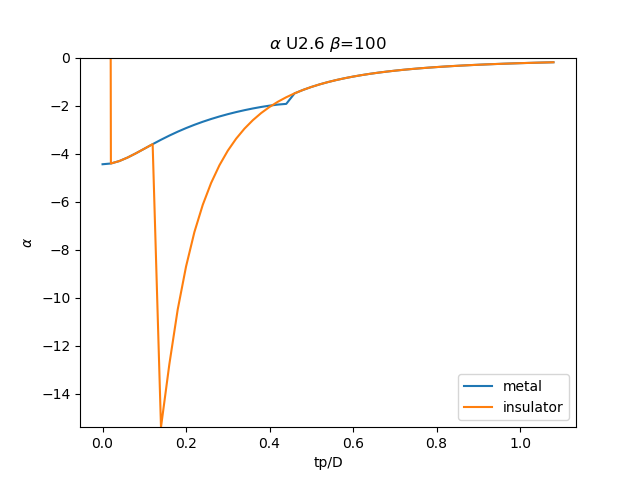
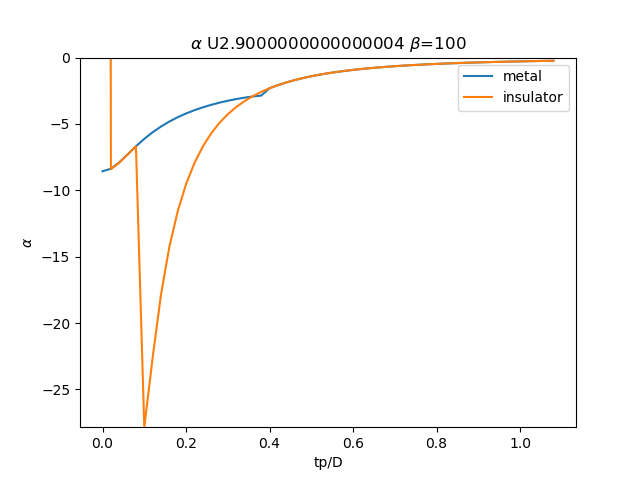
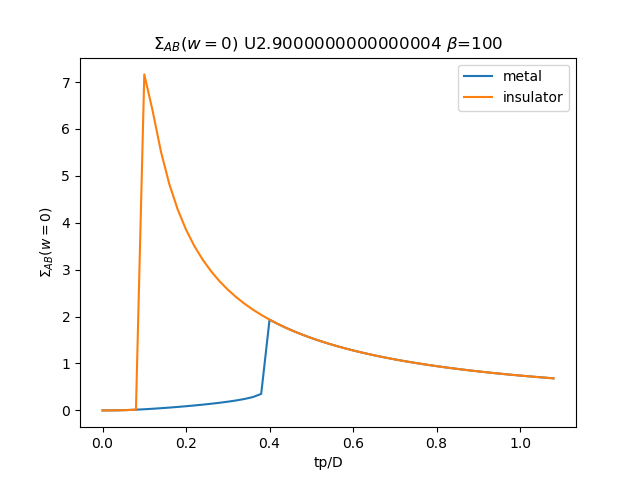
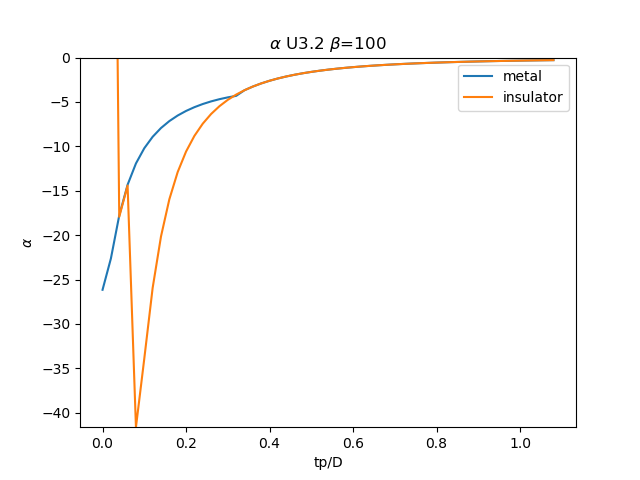
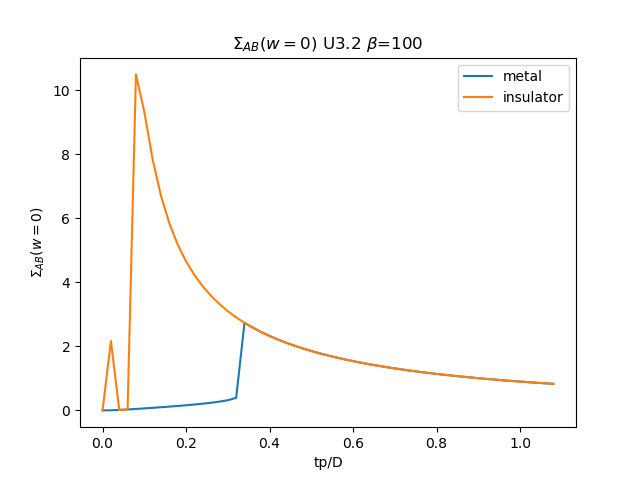
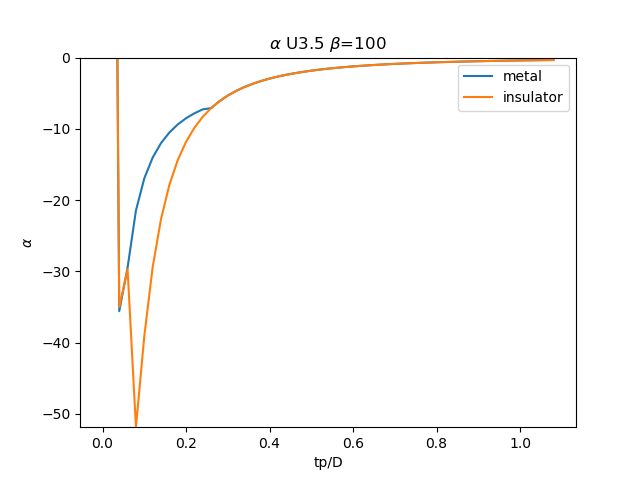
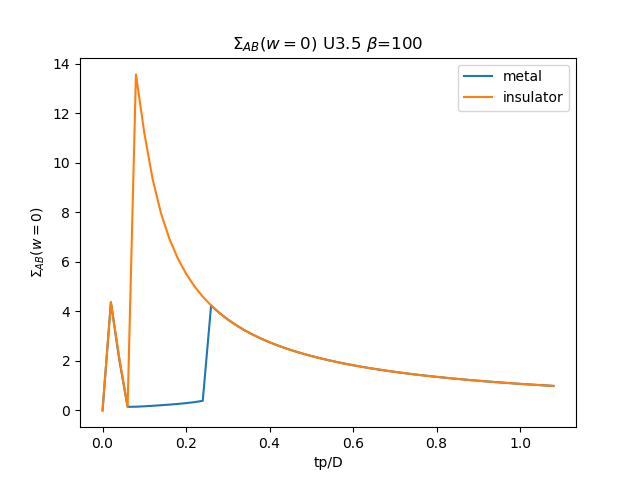
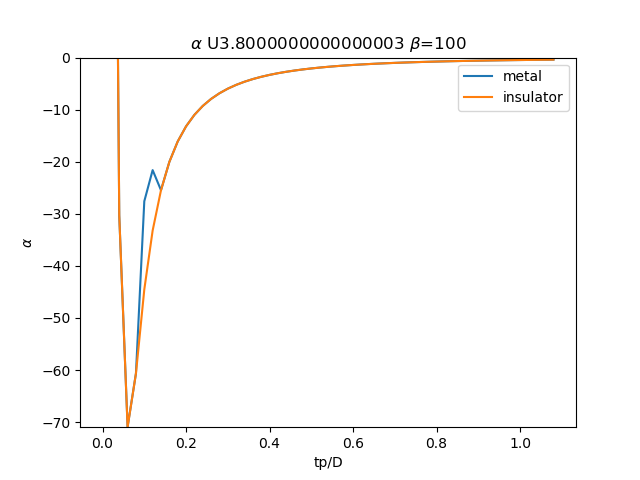
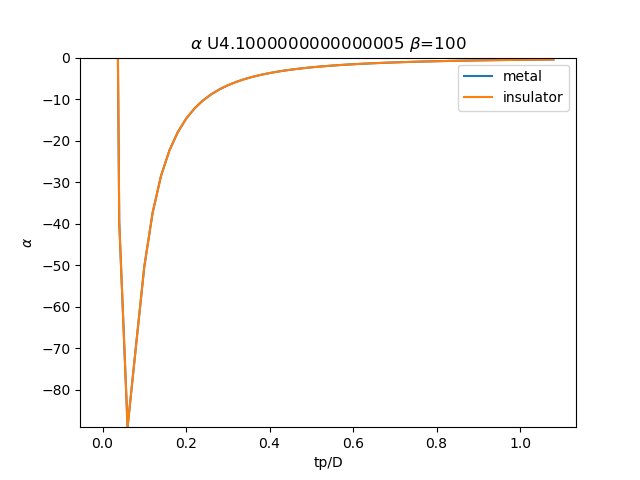
for i, u_int in list(enumerate(UR))[20::3]:
# Alpha
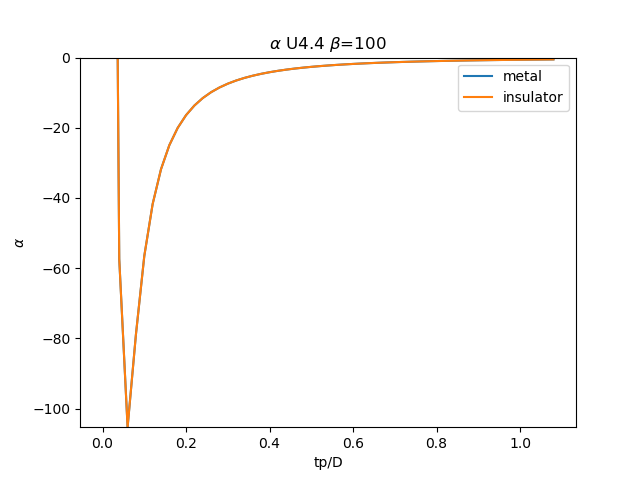
plt.figure()
plt.plot(TPR, sdm_zew[:, i, 0], label='metal')
plt.plot(TPR, sdi_zew[:, -1 - i, 0], label='insulator')
min_y = np.min(np.concatenate((sdm_zew[:, i, 0], sdi_zew[:, -1 - i, 0])))
plt.ylim([min_y, 0])
plt.legend()
plt.ylabel(r'$\alpha$')
plt.xlabel(r'tp/D')
plt.title(r'$\alpha$ U{} $\beta$=100'.format(u_int))
plt.savefig('SIGMA_AA_alpha_U{}_B100.png'.format(u_int))
# plt.close()
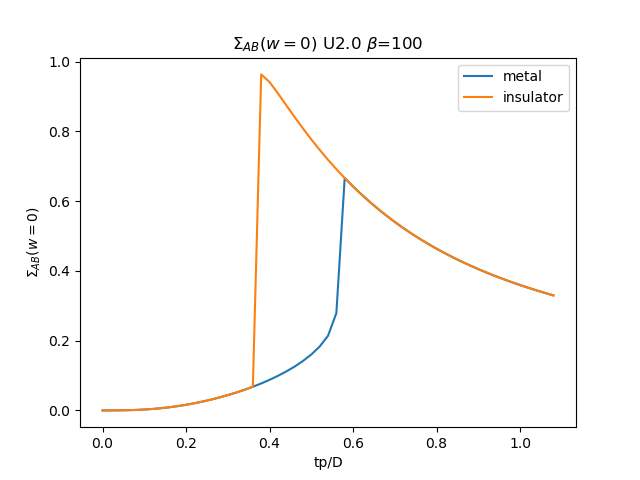
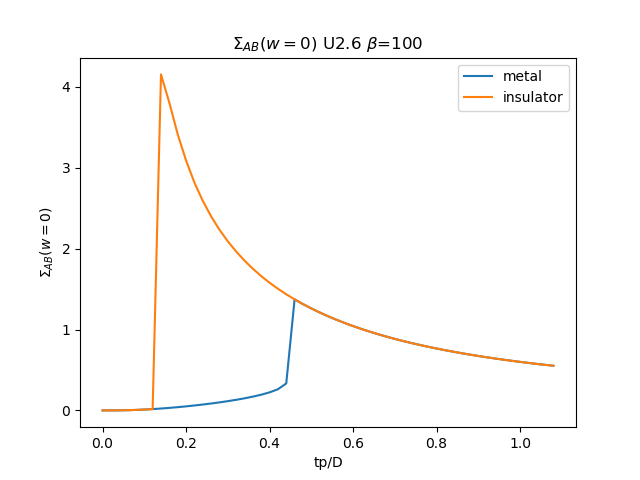
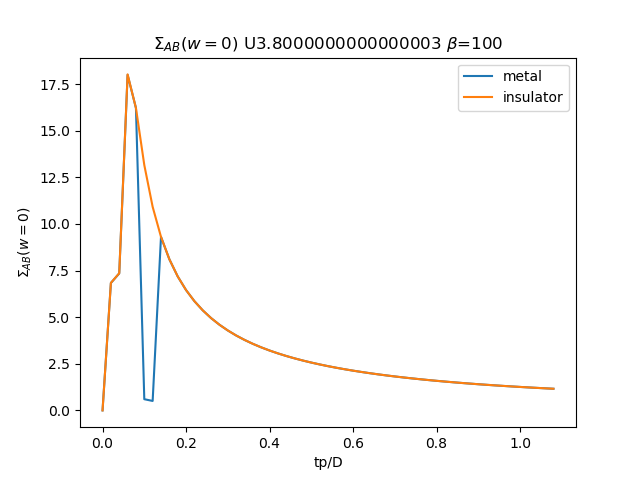
# \Sigma AB
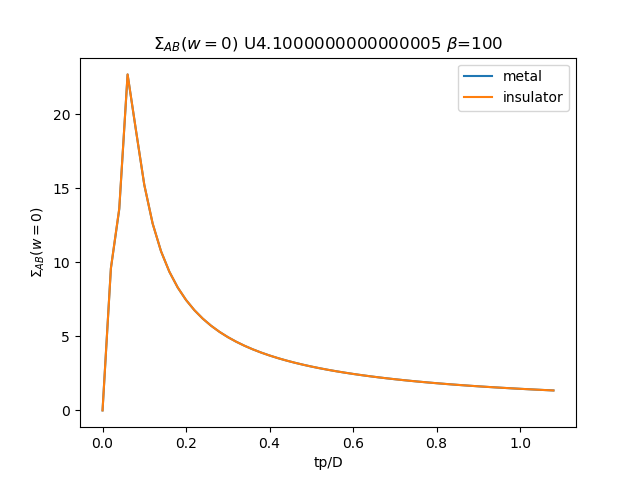
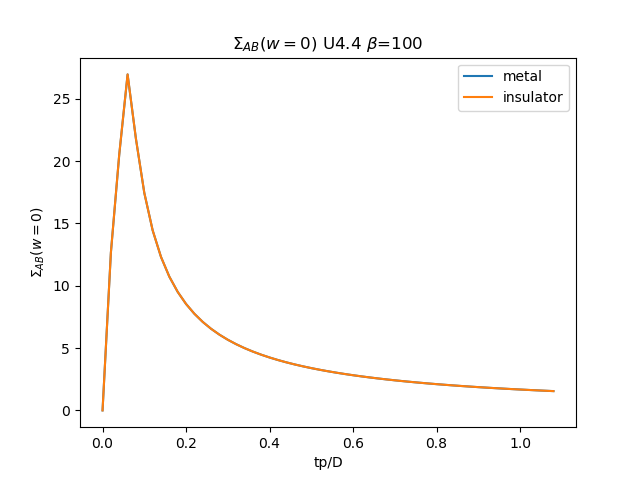
plt.figure()
plt.plot(TPR, som_zew[:, i, 1], label='metal')
plt.plot(TPR, soi_zew[:, -1 - i, 1], label='insulator')
plt.legend()
plt.ylabel(r'$\Sigma_{{AB}}(w=0)$')
plt.xlabel(r'tp/D')
plt.title(r'$\Sigma_{{AB}}(w=0)$ U{} $\beta$=100'.format(u_int))
plt.savefig('SIGMA_AB_cut_U{}_B100.png'.format(u_int))
# plt.close()


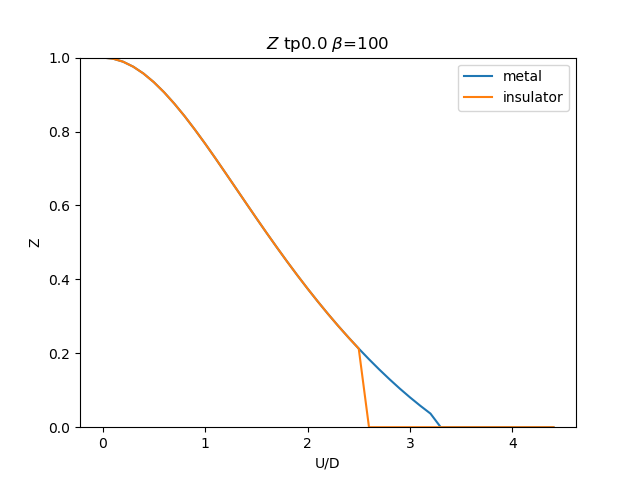
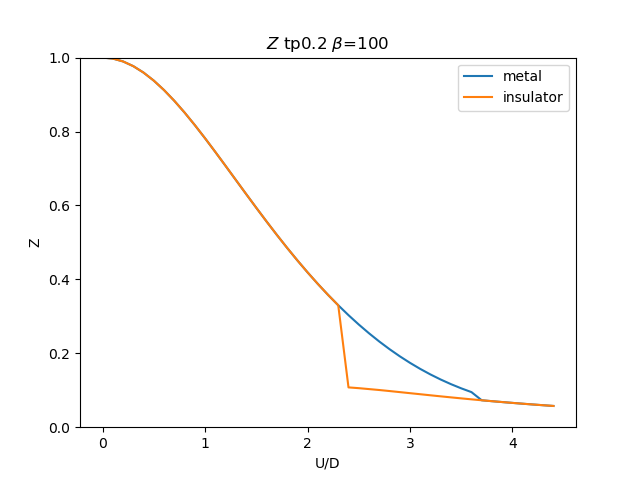
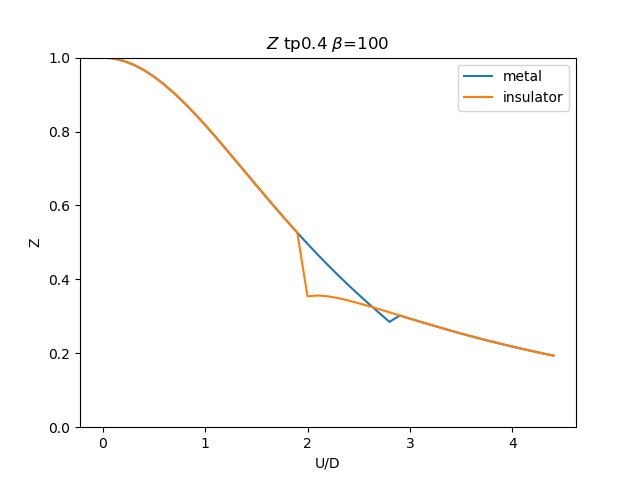
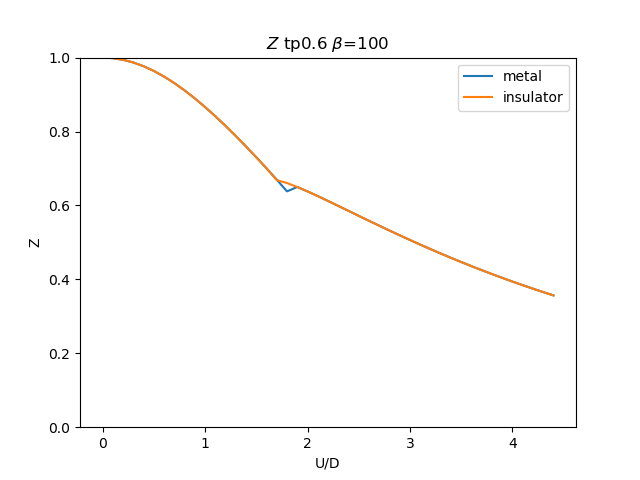
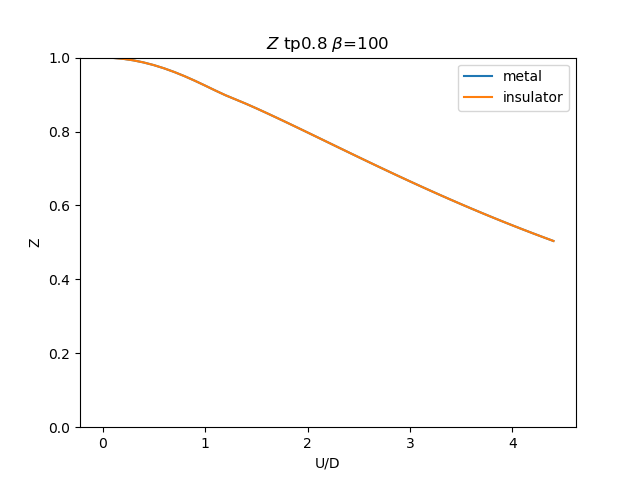
Quasiparticle observables
for i, tp in list(enumerate(TPR))[::10]:
# Z
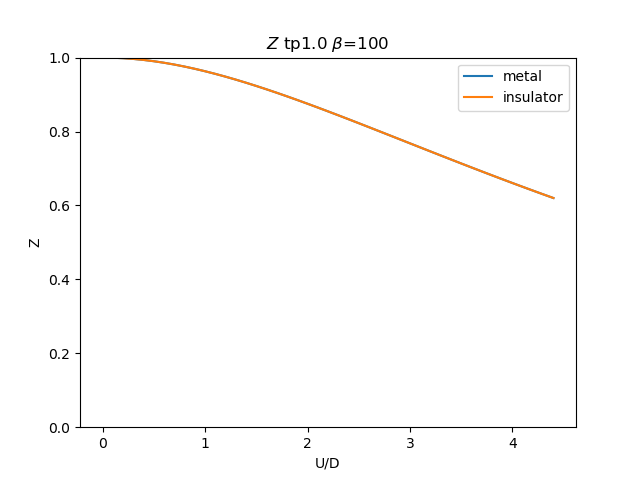
plt.figure()
plt.plot(UR, np.clip(1 / (1 - sdm_zew[i, :, 0]), 0, 1), label='metal')
plt.plot(UR, np.clip(
1 / (1 - sdi_zew[i, ::-1, 0]), 0, 1), label='insulator')
plt.legend()
plt.ylim([0, 1])
plt.ylabel(r'Z')
plt.xlabel(r'U/D')
plt.title(r'$Z$ tp{} $\beta$=100'.format(tp))
plt.savefig('Z_tp{}_B100.png'.format(tp))
# plt.close()
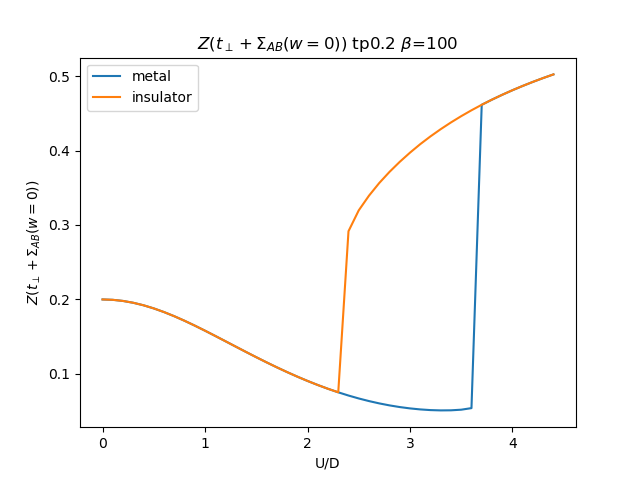
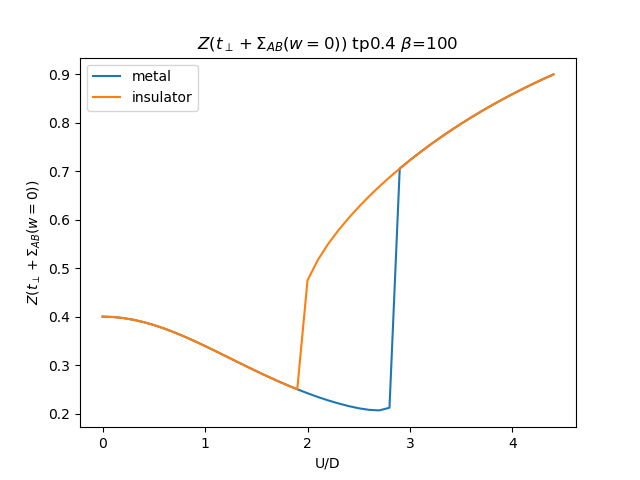
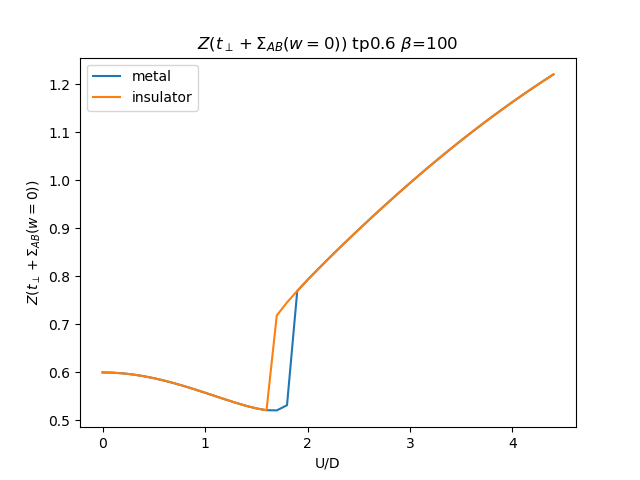
# Z \Sigma AB
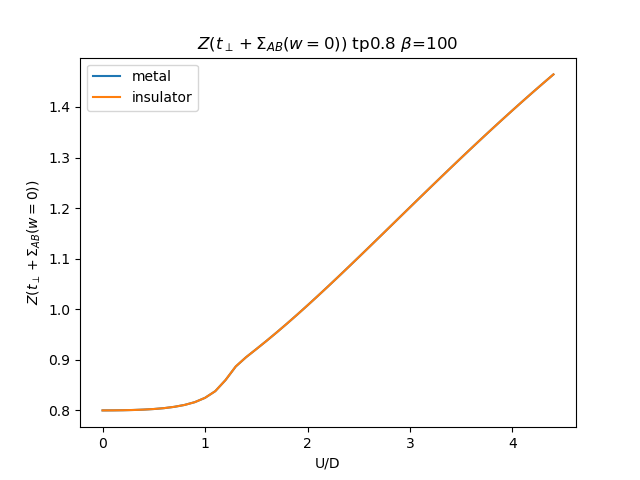
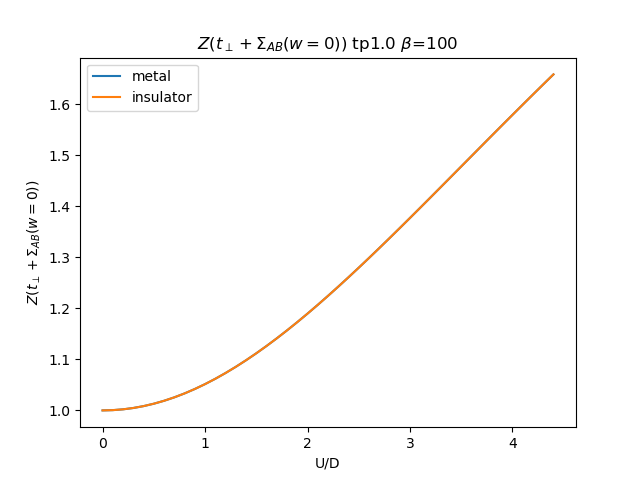
plt.figure()
plt.plot(UR, (tp + som_zew[i, :, 1]) * np.clip(1 /
(1 - sdm_zew[i, :, 0]), 0, 1), label='metal')
plt.plot(UR, (tp + soi_zew[i, ::-1, 1]) * np.clip(1 /
(1 - sdi_zew[i, ::-1, 0]), 0, 1), label='insulator')
plt.legend()
plt.ylabel(r'$Z(t_\perp + \Sigma_{{AB}}(w=0))$')
plt.xlabel(r'U/D')
plt.title(r'$Z(t_\perp + \Sigma_{{AB}}(w=0))$ tp{} $\beta$=100'.format(tp))
plt.savefig('ZSIGMA_AB_cut_tp{}_B100.png'.format(tp))
# plt.close()
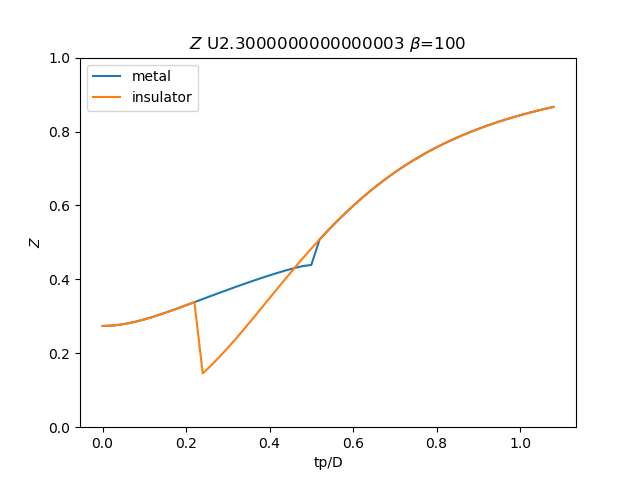
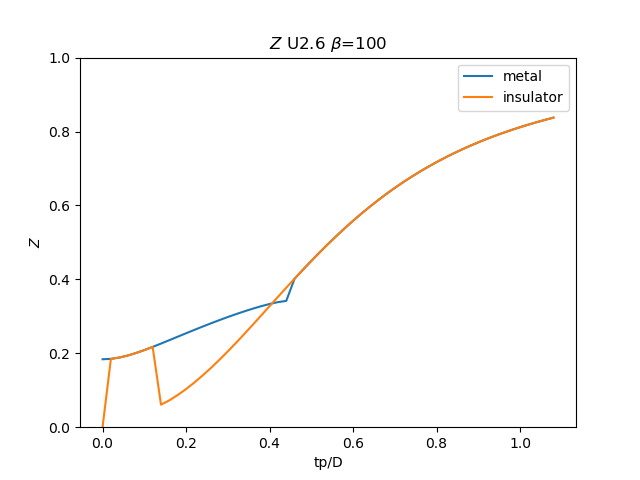
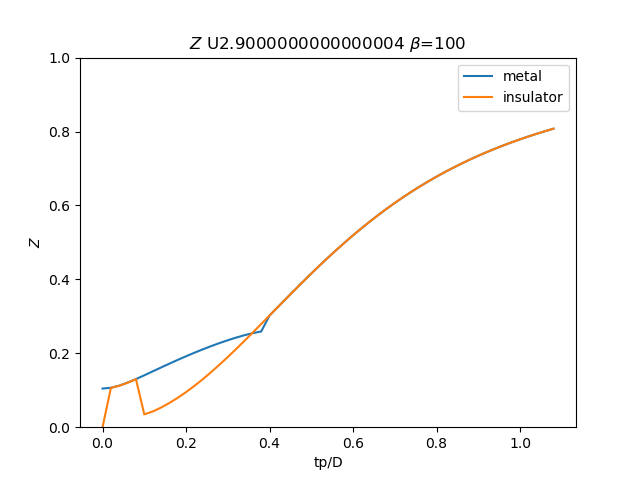
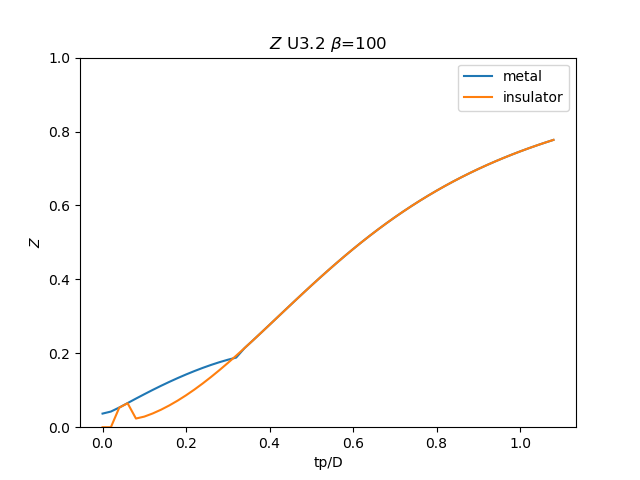
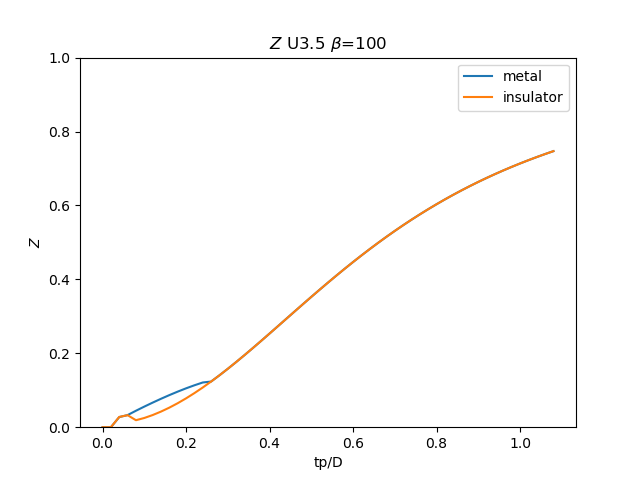
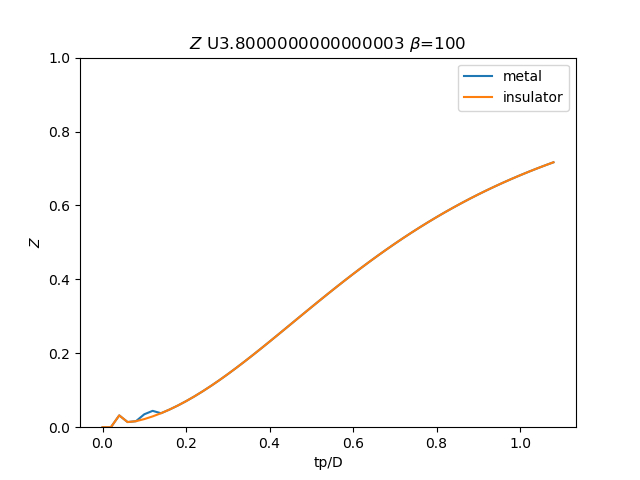
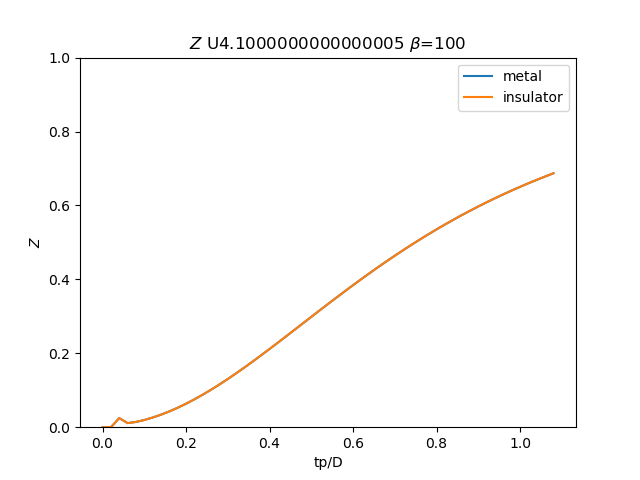
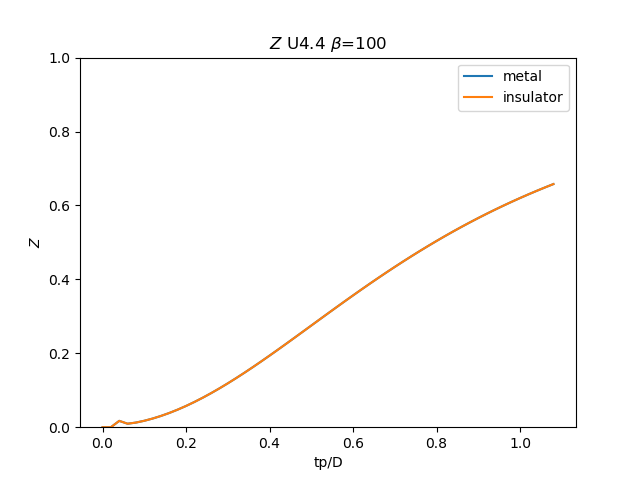
for i, u_int in list(enumerate(UR))[20::3]:
# Z
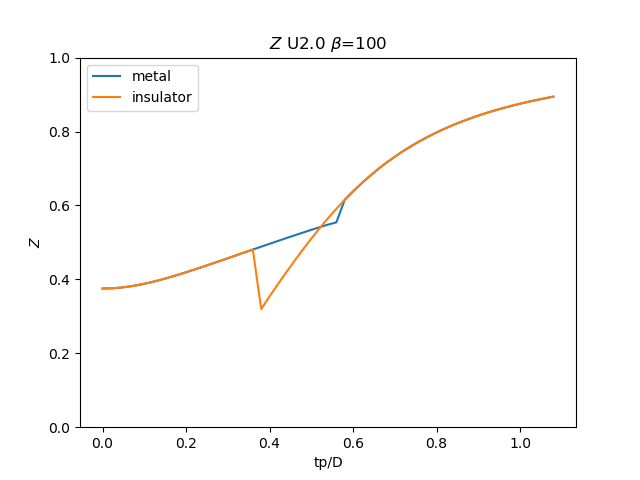
plt.figure()
plt.plot(TPR, np.clip(1 / (1 - sdm_zew[:, i, 0]), 0, 1), label='metal')
plt.plot(TPR, np.clip(
1 / (1 - sdi_zew[:, -1 - i, 0]), 0, 1), label='insulator')
min_y = np.min(np.concatenate((sdm_zew[:, i, 0], sdi_zew[:, -1 - i, 0])))
plt.ylim([0, 1])
plt.legend()
plt.ylabel(r'$Z$')
plt.xlabel(r'tp/D')
plt.title(r'$Z$ U{} $\beta$=100'.format(u_int))
plt.savefig('Z_U{}_B100.png'.format(u_int))
# plt.close()
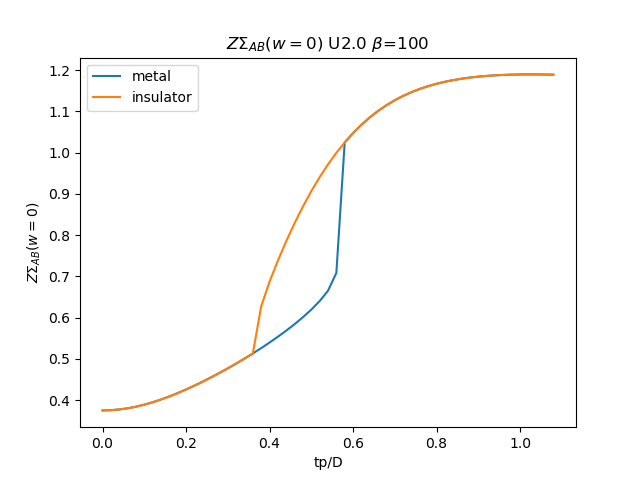
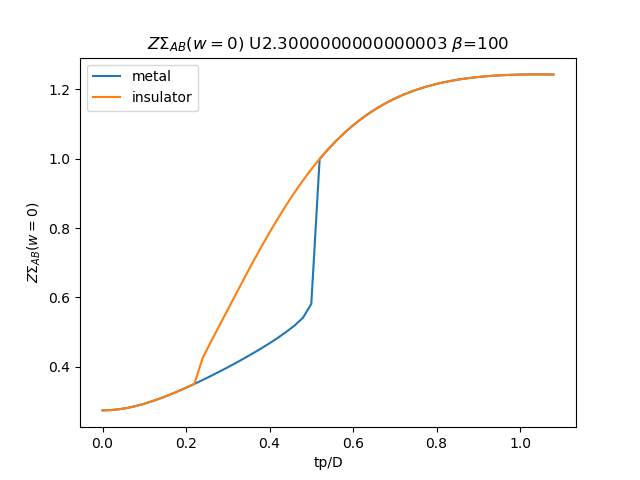
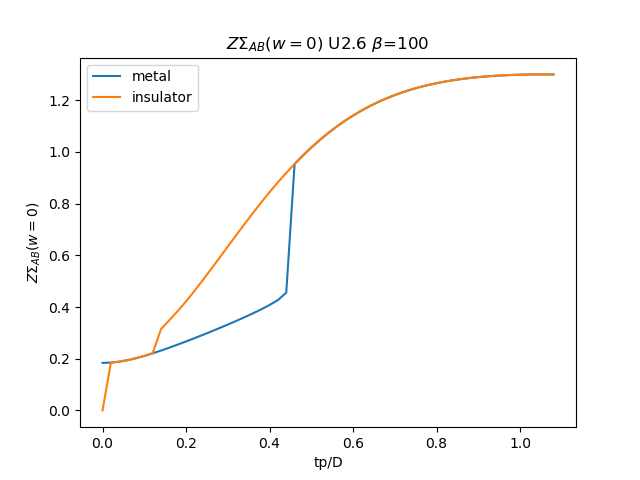
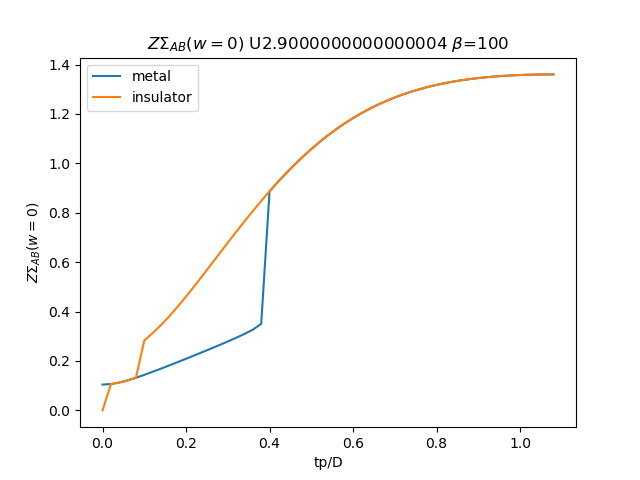
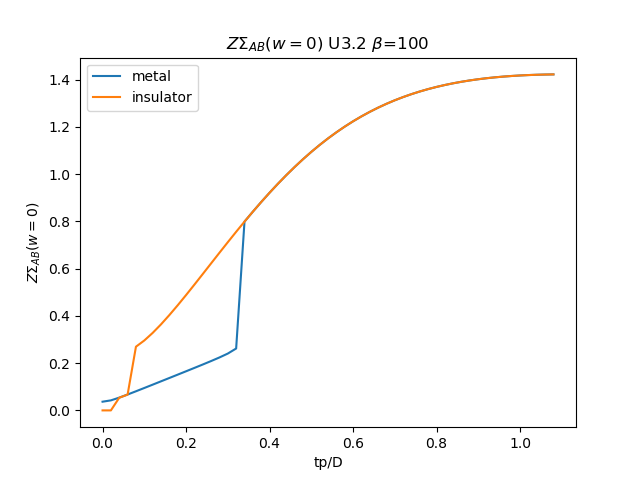
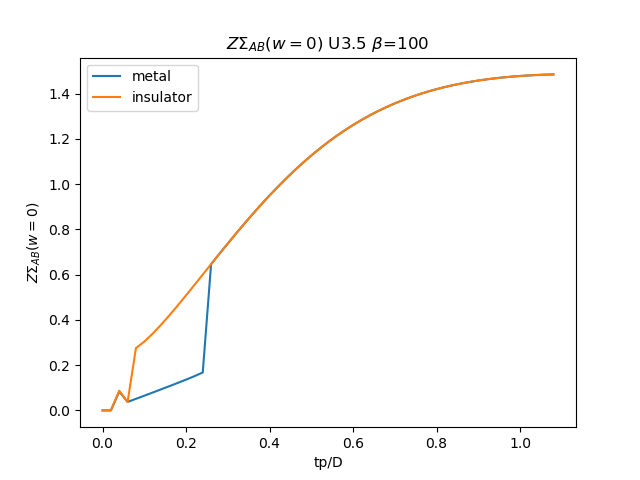
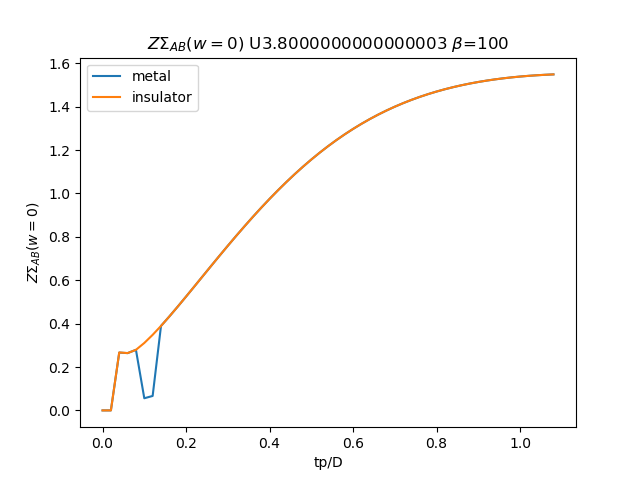
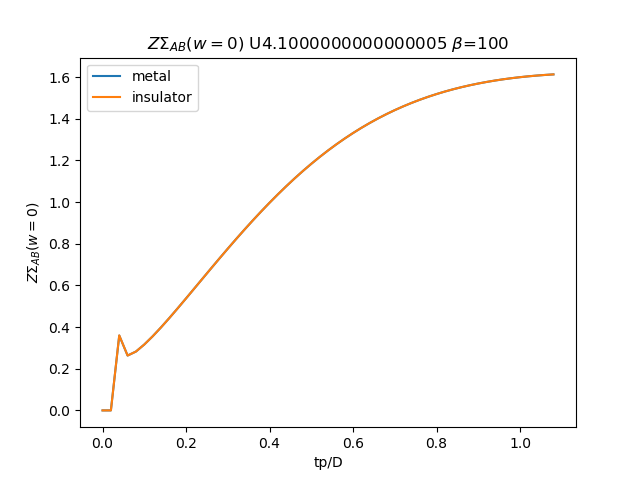
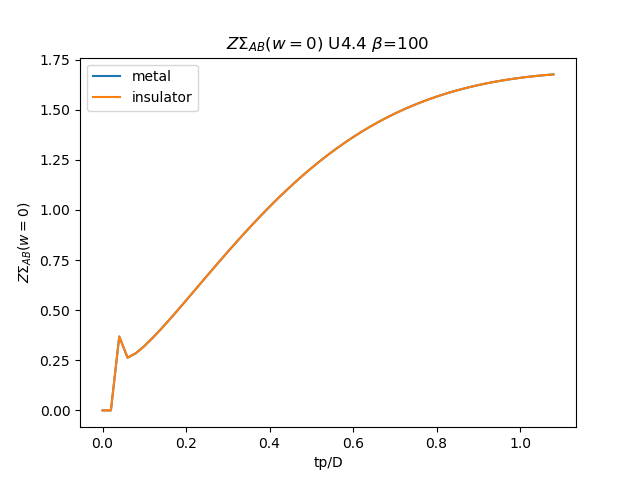
# Z \Sigma AB
plt.figure()
plt.plot(TPR, (tp + som_zew[:, i, 1]) * np.clip(1 /
(1 - sdm_zew[:, i, 0]), 0, 1), label='metal')
plt.plot(TPR, (tp + soi_zew[:, -1 - i, 1]) * np.clip(1 /
(1 - sdi_zew[:, -1 - i, 0]), 0, 1), label='insulator')
plt.legend()
plt.ylabel(r'$Z\Sigma_{{AB}}(w=0)$')
plt.xlabel(r'tp/D')
plt.title(r'$Z\Sigma_{{AB}}(w=0)$ U{} $\beta$=100'.format(u_int))
plt.savefig('ZSIGMA_AB_cut_U{}_B100.png'.format(u_int))
# plt.close()
Total running time of the script: ( 0 minutes 22.488 seconds)